Plugin Information |
|---|
View Splunk on the plugin site for more information. |
Older versions of this plugin may not be safe to use. Please review the following warnings before using an older version:
The plugin is used together with a Splunk App for Jenkins that provides out-of-the-box dashboards and search capabilities to enable organizations to run a high performing Jenkins cluster and bring operational intelligence into the software development life cycle.
Splunk Plugin for Jenkins
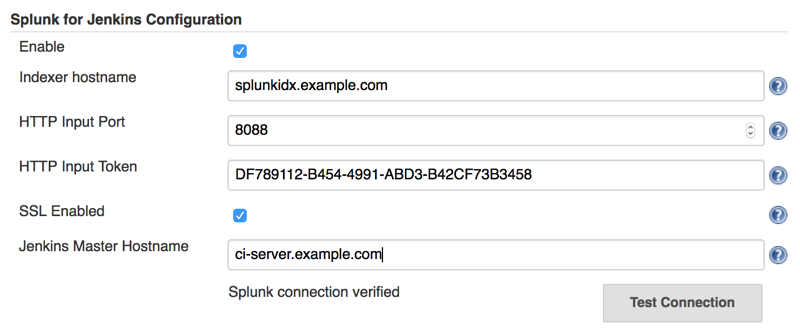
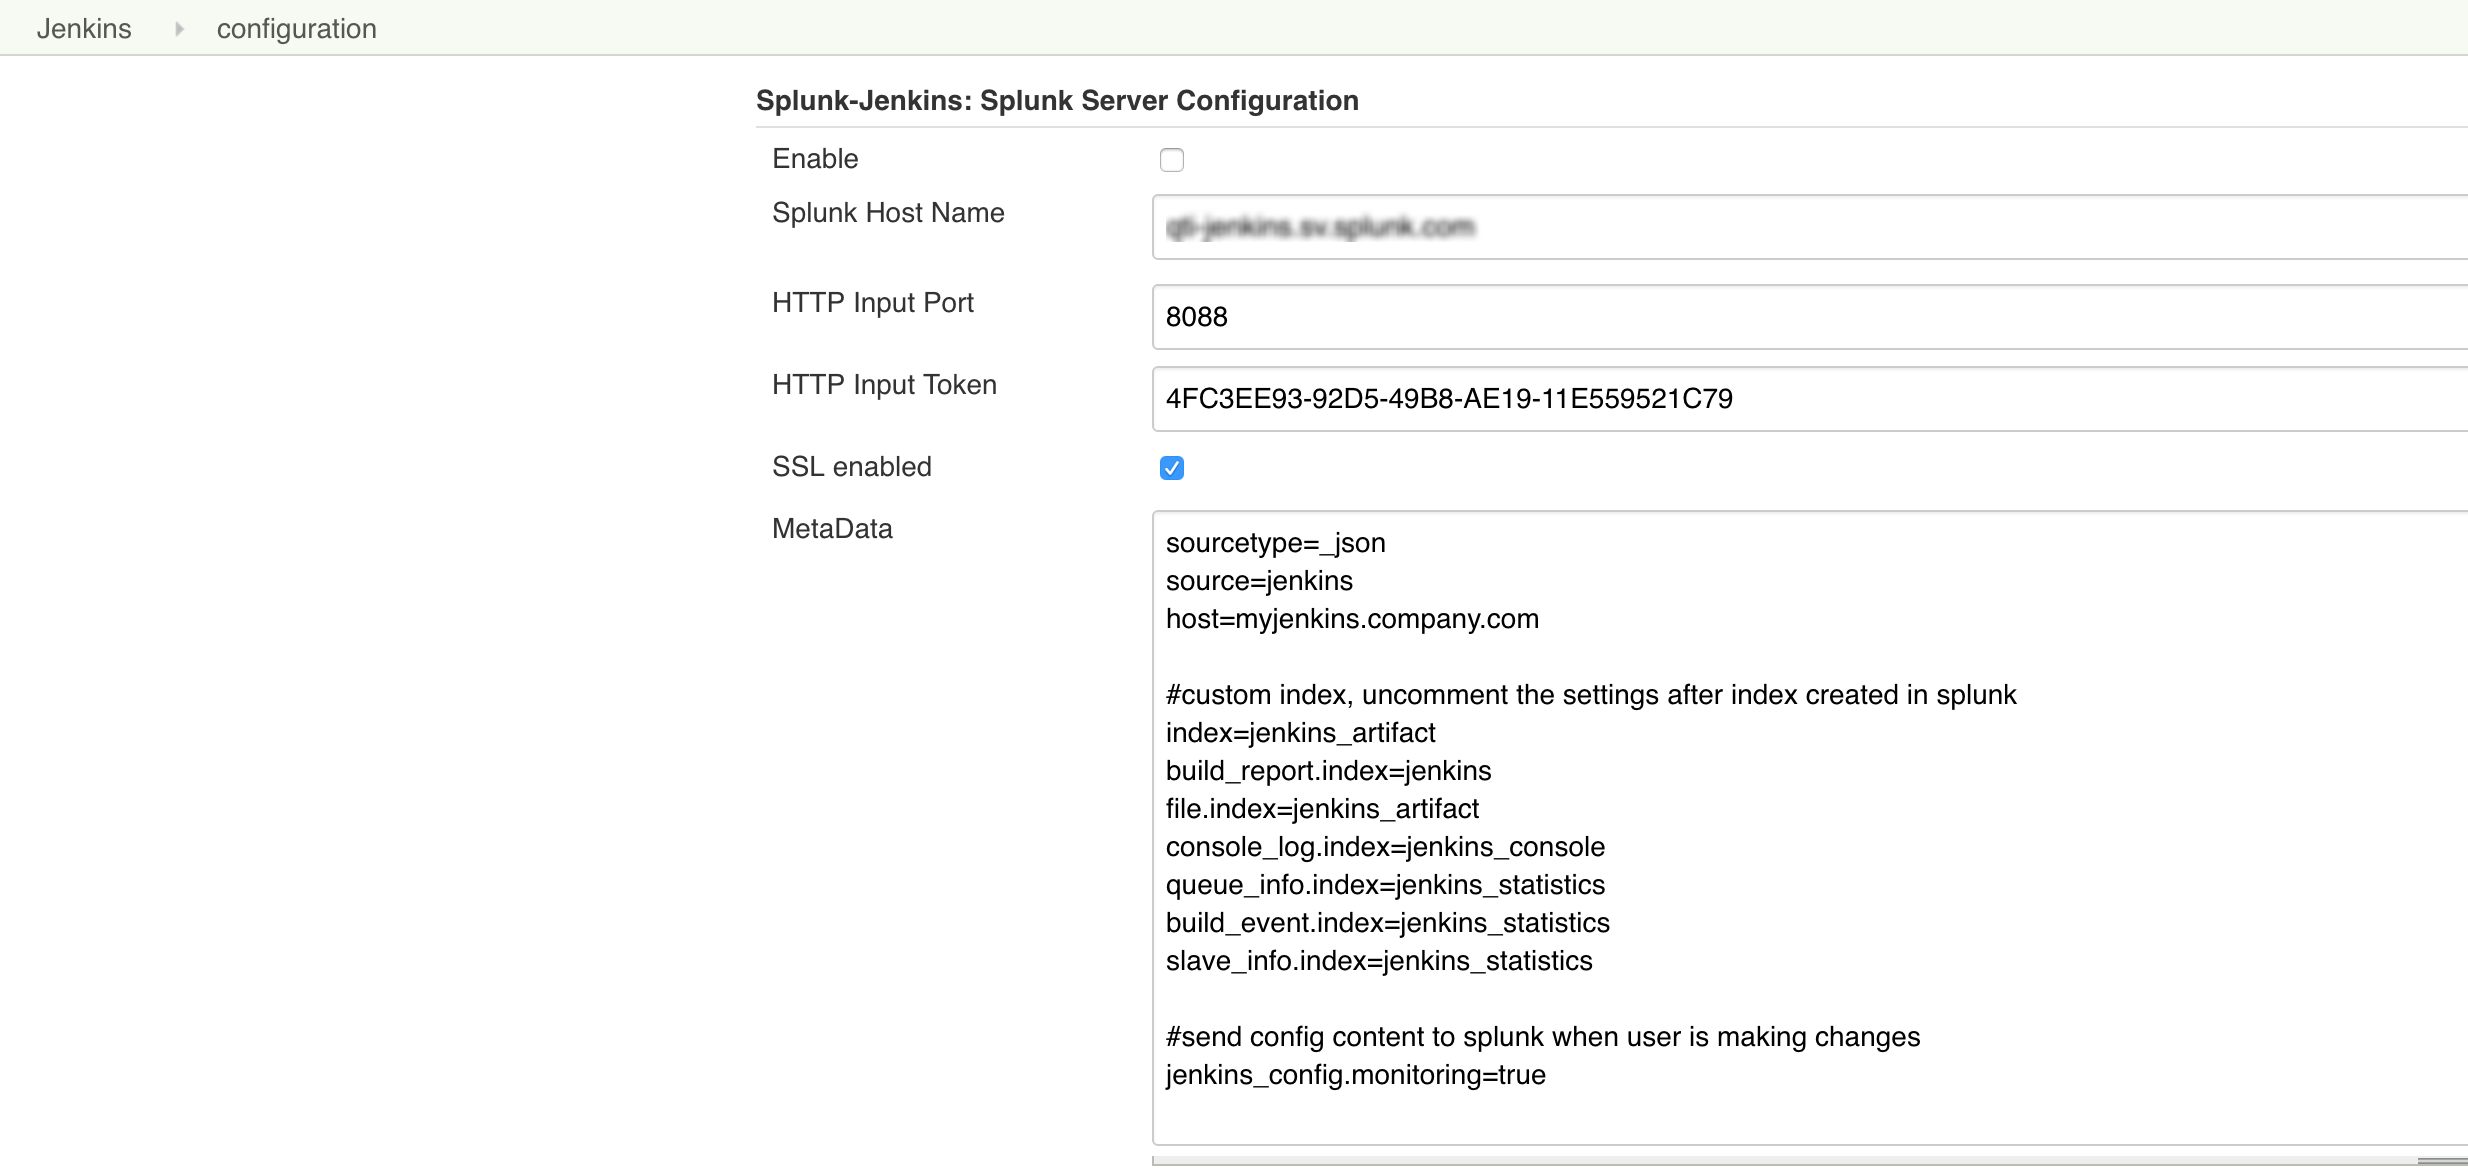
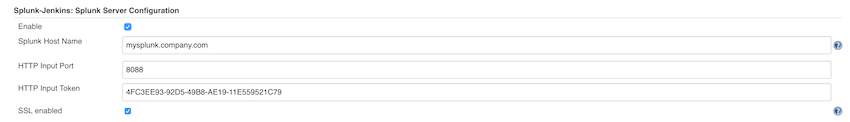
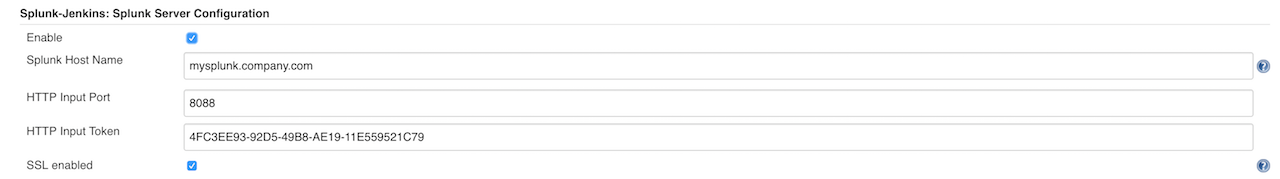
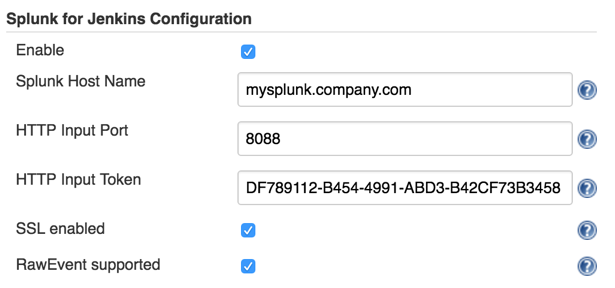
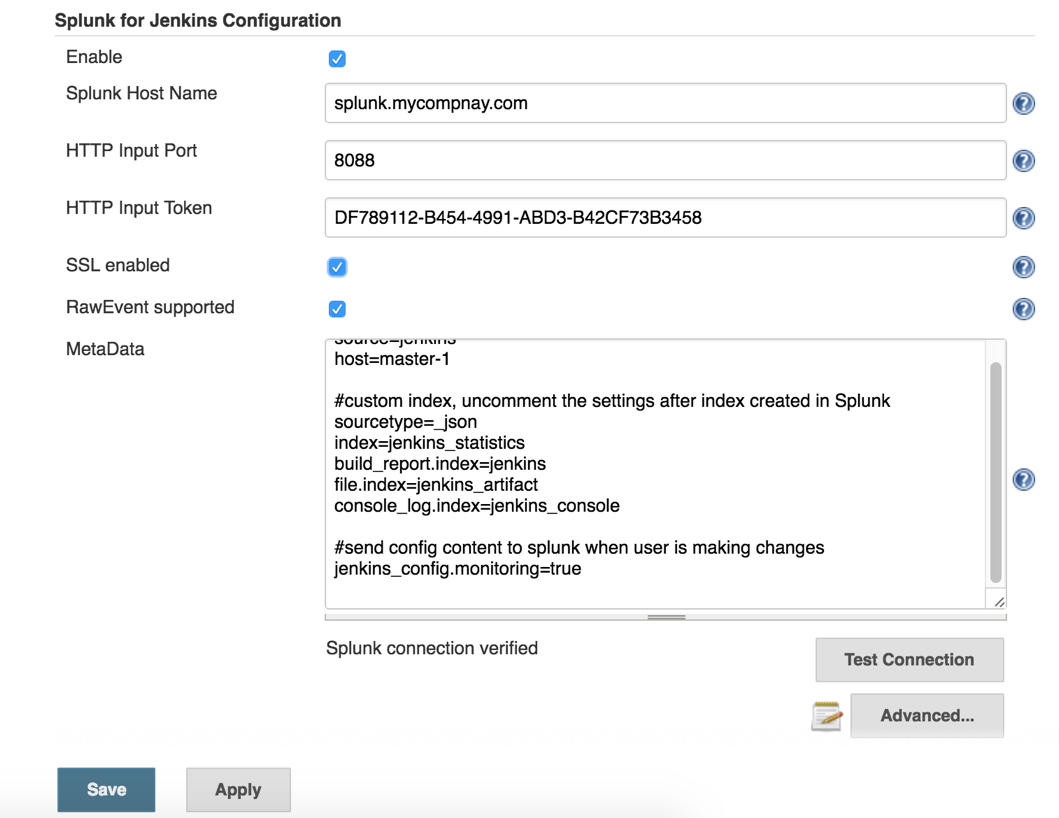
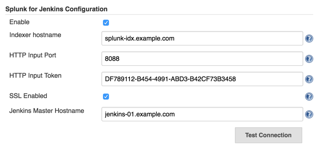
1. Configure Splunk Server
- Go to https://<jenkins-url>/configure
- Enter Hostname, Port, and Token
- For Splunk cloud user, the host name is something like http-inputs-xx.splunkcloud.com or http-inputs-xx.cloud.splunk.com, port is 443
- For Splunk enterprise user, the host name is the indexer host name, and port is 8088 by default
- Check "Raw Events Supported" if you are using Splunk version 6.3.1511 or later
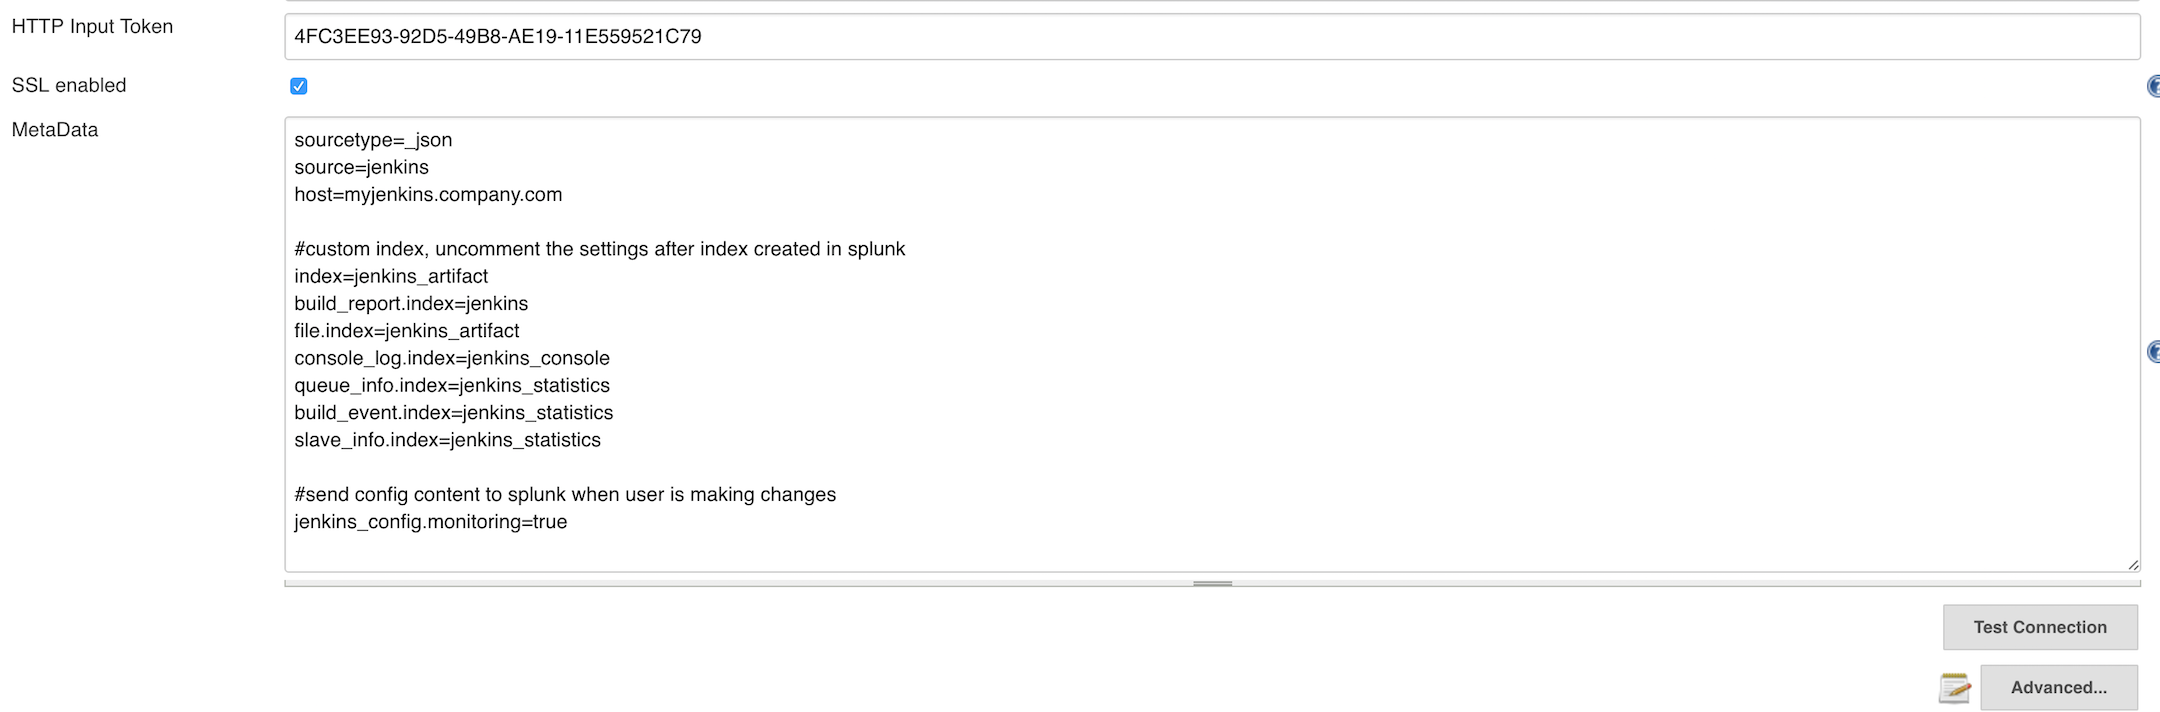
- SSL is enabled by default in Splunk, it will protect the data transferred on network.
- Click "Test Connection" to verify the setup
- Check "Enable" and Save
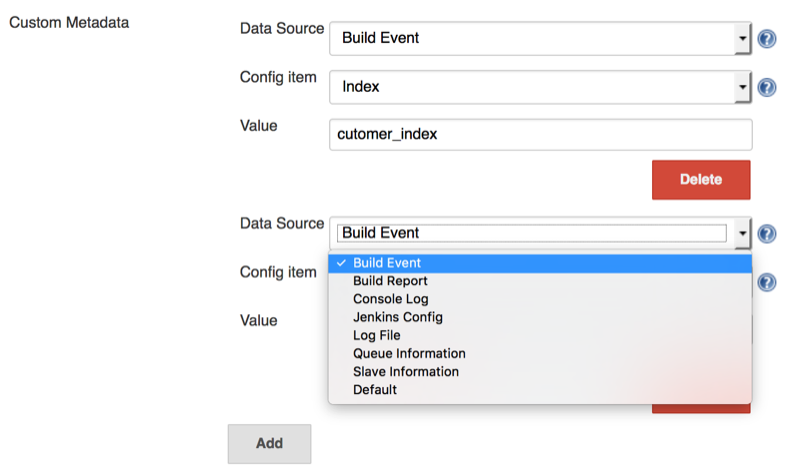
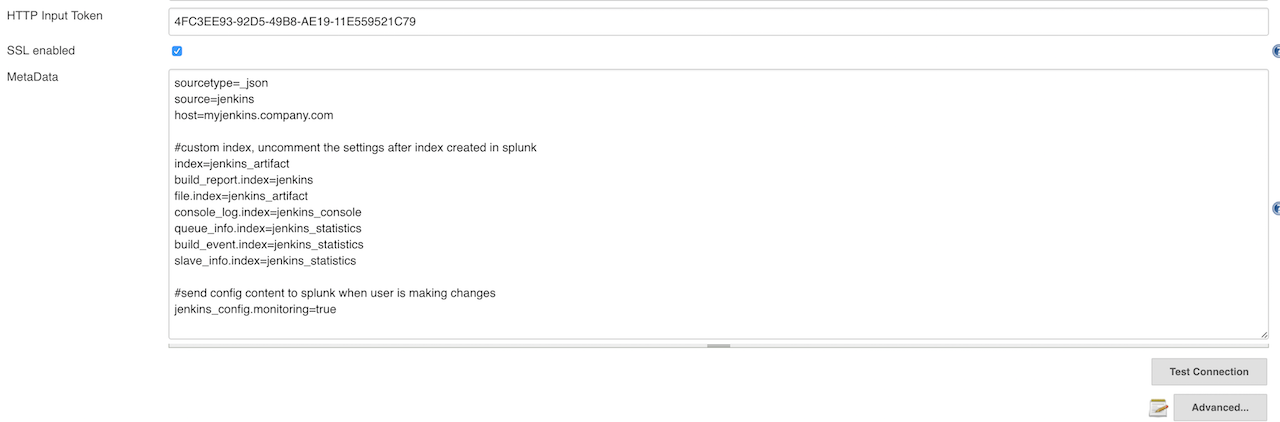
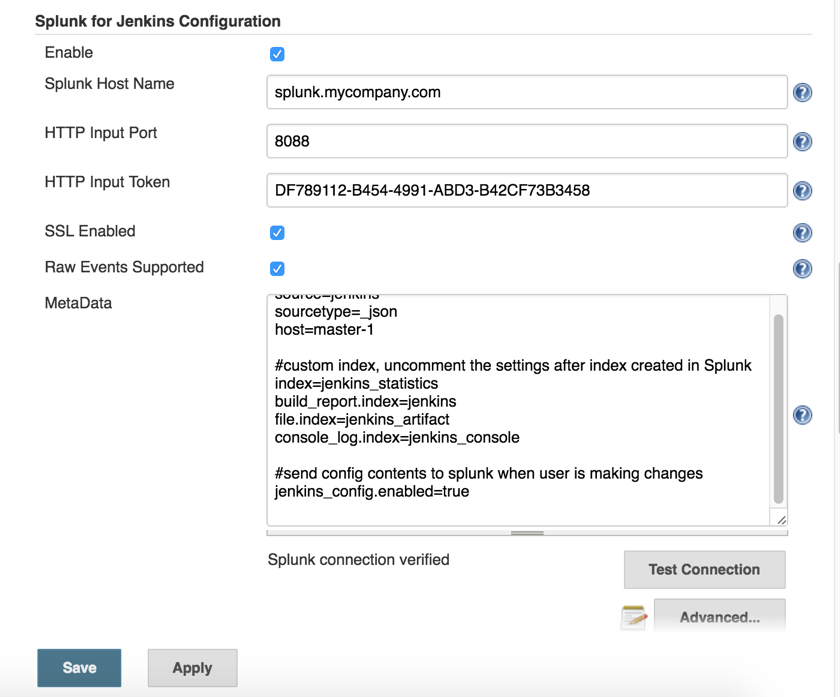
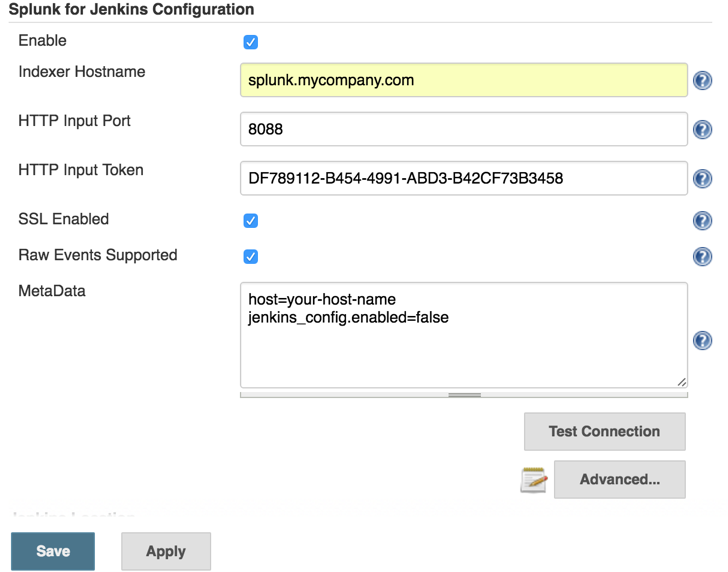
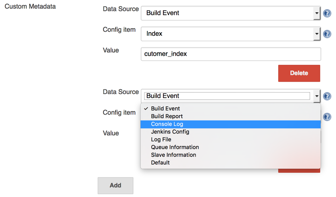
2. Configure Metadata
Specify index, host, sourcetype for the various events. Metadata can be configured to collect as little or as much Jenkins information as you need and sent to Splunk for analysis.
- index is a data repository in Splunk, you can set a different data retention policy and access privileges for each index in Splunk. You need create the index in Splunk manually, the plugin will not create any index.
- sourcetype is used by Splunk to determine how incoming data is formatted, see also Why sourcetype matters
- host is used to identify which Jenkins master is the source of the data
There are 7 types of events which can be customized
Build Report | Junit or other Reports sent by calling "send(message)" DSL script |
Build Event | Sent when job are started and completed |
Queue Information | Basic queue information and Jenkins health metrics, sent when queue get updated and every 45 seconds by default. |
Console Log | Build console log, e.g. job/abc/123/console, slave log and Jenkins master log (jenkins.log) |
Log File | Artifact contents, send by calling "archive(includes)" DSL script |
Slave Information | The slave(agent) health metrics, sent every 8 minutes by default. You can add "-Dcom.splunk.splunkjenkins.slaveMonitorMinutes=N" to Jenkins start parameters to adjust the timing |
Jenkins Config | The contents of Jenkins configuration items, e.g. config.xml, sent when the config file get updated. |
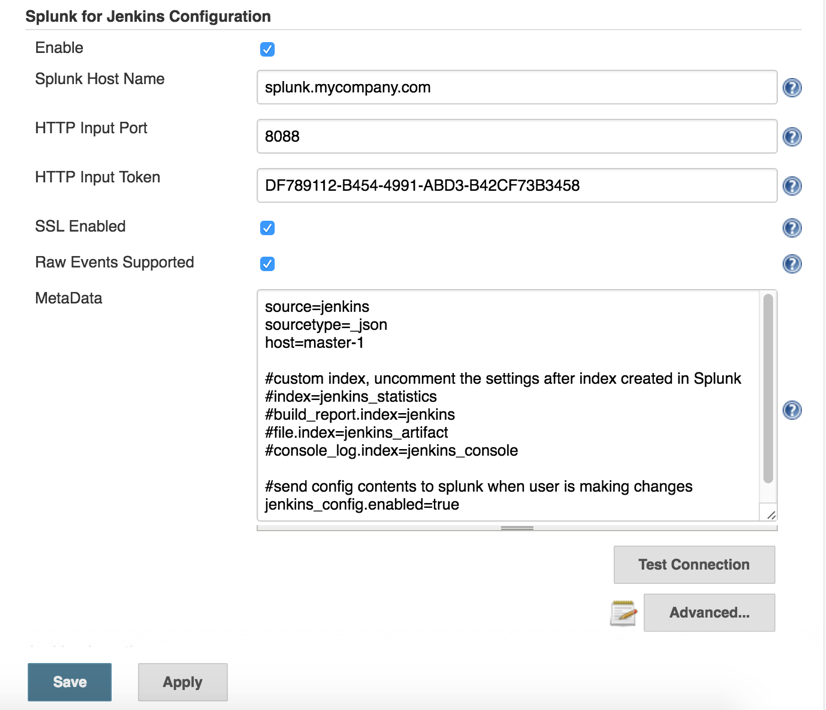
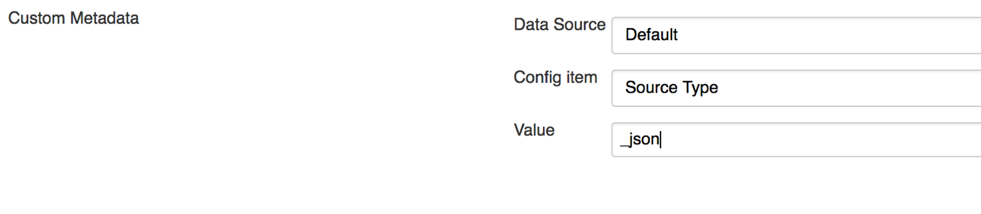
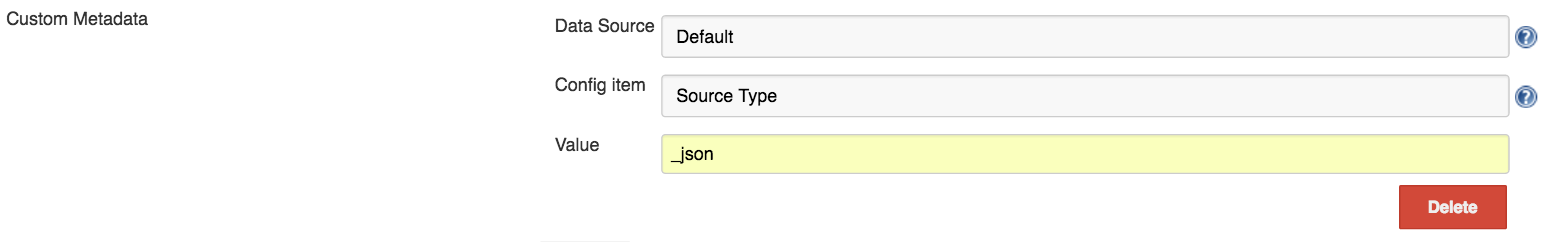
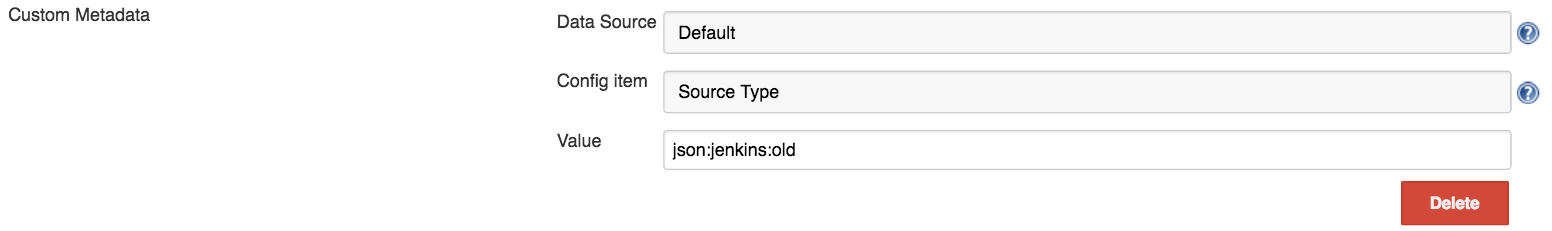
you can customize the index, sourcetype in the "Custom Metadata" section.
2.1. Metadata configuration for Splunk App for Jenkins
- For Splunk version 6.5 or later, it is recommended to use the plugin's default config
- For Splunk 6.3.x or 6.4.x, please adjust the default sourcetype to json:jenkins:old (please remove it if Splunk get upgraded to latest version otherwise data will be extracted twice)

3. Customize The Job Data Sent to Splunk
In the Advanced configuration section, you can customize the post data using groovy DSL.
While the default settings should suffice for most Jenkins users, the Advanced configuration section allows you to use groovy DSL to customize the data sent to Splunk.
The groovy script can use the variable splunkins, which provides access to the following objects and methods:
send(Object message)will send the information to splunkgetBuildEvent()will return metadata about the build, such as build result, build URL, user who triggered the buildgetJunitReport(int pageSize)will return a list of test results, which contains total, passes, failures, skips, time and testcase of type List<hudson.tasks.junit.CaseResult>getJunitReport(int pageSize, List<String> ignoredTestResultActions)will return a list of test results except test formats specified in ignoredTestResultActionssendCoverageReport(pageSize)send coverage, each event contains max pageSize metricsgetJunitReport()is an alias ofgetJunitReport(Integer.MAX_VALUE)archive(String includes, String excludes, boolean uploadFromSlave, String fileSizeLimit)send log file to splunkarchive(String includes)is an alias ofarchive(includes, null, false, "")getAction(Class type)is an alias ofbuild.getAction(type)getActionByClassName(String className)same asgetAction(Class type)but no need to import the class before usehasPublisherName(String className)check whether the publisher is configured for the build (applied to AbstractBuild only)- Here is the default settings for post job data processing (since v.1.5.0)
//send job metadata and junit reports with page size set to 50 (each event contains max 50 test cases)
splunkins.sendTestReport(50)
//send coverage, each event contains max 50 class metrics
splunkins.sendCoverageReport(50)
//send all logs from workspace to splunk, with each file size limits to 10MB
splunkins.archive("**/*.log", null, false, "10MB")
4. Customize log files at job level (optional)
Jenkins builds can produce many artifacts which can contain useful build information. The plugin can be configured globally (step #3) to collect all artifacts using the archive command. You can also specify what artifacts to send to Splunk at the job level by adding Splunk's post-build action 'Send data to Splunk'
- Add a "post-build action" called "Send data to Splunk"
- Enter an ant-style pattern matching string for your junit xml collection

5. System properties (optional)
System properties are defined by passing -Dproperty=value to the java command line to start Jenkins. Make sure to pass all of these arguments before the -jar argument, otherwise they will be ignored. Example: java -Dsplunkins.buffer=4096 -jar jenkins.war
| Property | Default Value | Note |
|---|---|---|
| splunkins.buffer | 4096 | console log buffer size |
| com.splunk.splunkjenkins.JdkSplunkLogHandler.level | INFO | log message levels lower than this will not be send to splunk |
| splunkins.debugLogBatchSize | 128 | batch size for sending verbose level (FINE,FINER,FINEST) log record |
| splunkins.consoleLogFilterPattern | (empty) | regular expression for 'interesting' build. if it is set, only send console log to splunk for the job whose build url matches the pattern |
| splunkins.ignoreConfigChangePattern | (queue|nodeMonitors|UpdateCenter|global-build-stats|fingerprint|build)(.*?xml) | regular expression for ignoring config file changes |
Splunk Dashboards for Jenkins
You can download and install the Splunk App for Jenkins from https://splunkbase.splunk.com/app/3332
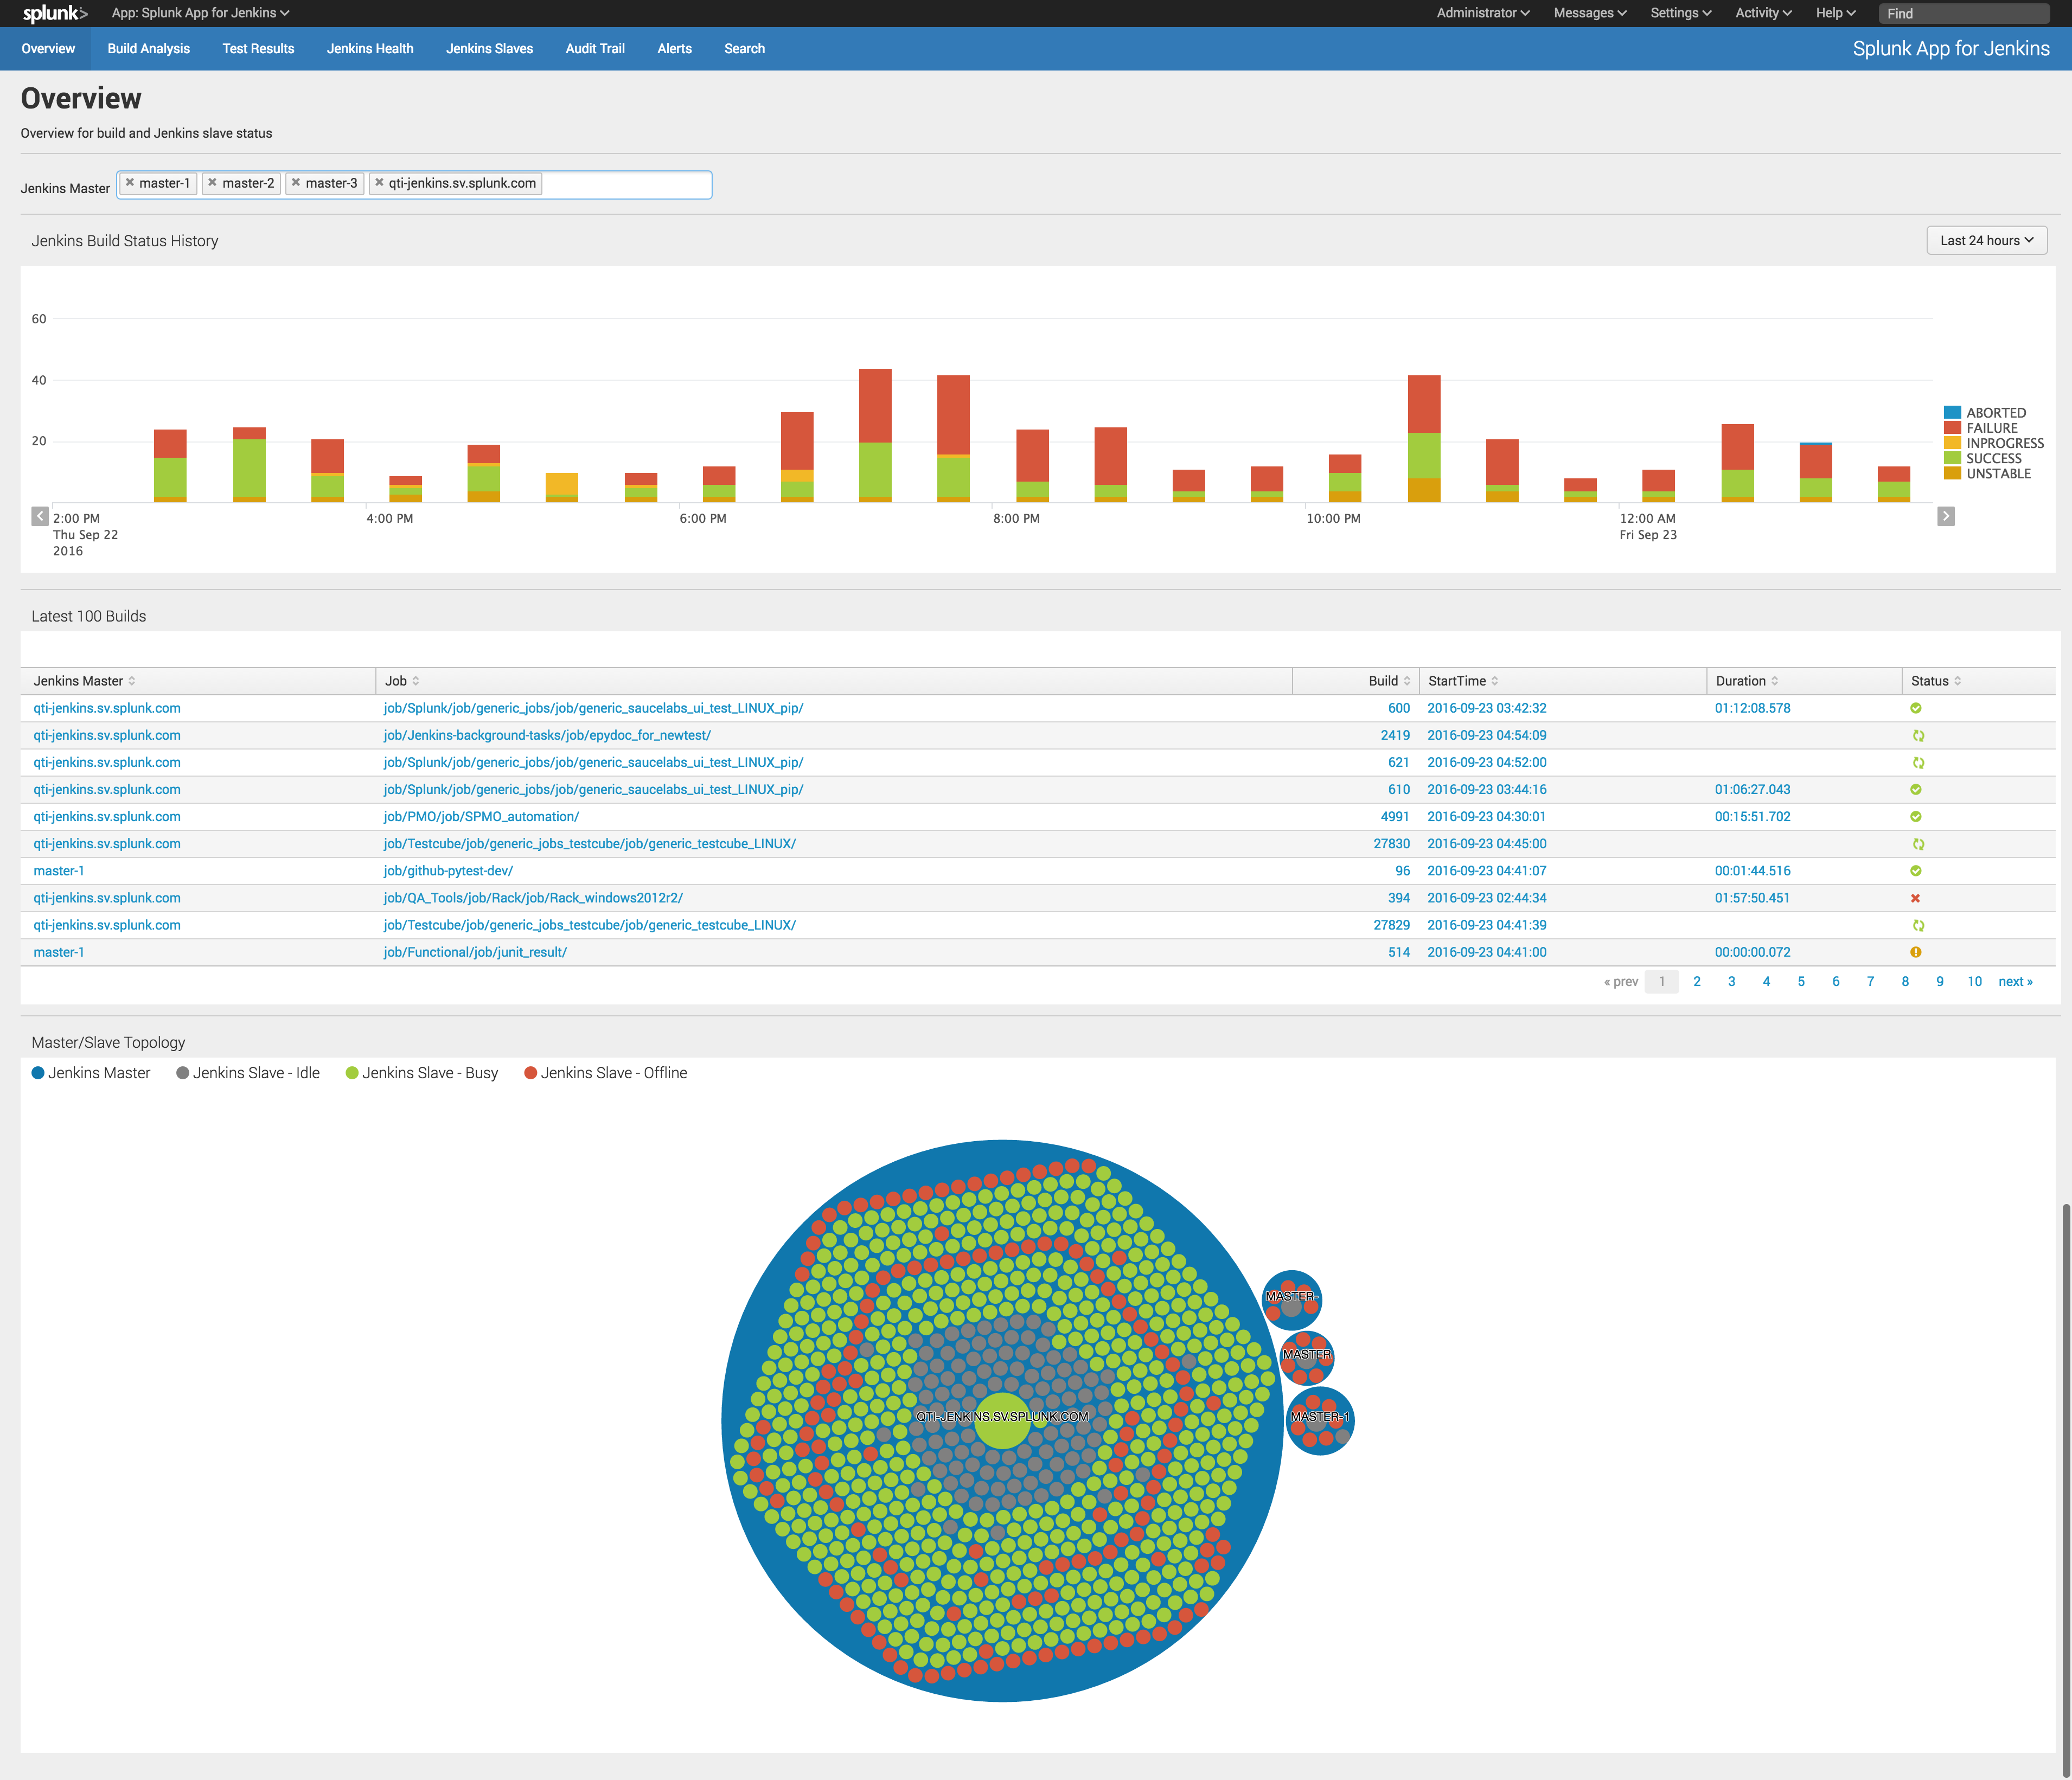
Once installed, the Splunk App will use the data being sent by the Splunk plugin for Jenkins and show various dashboards and search capabilities. Here are some of the key features
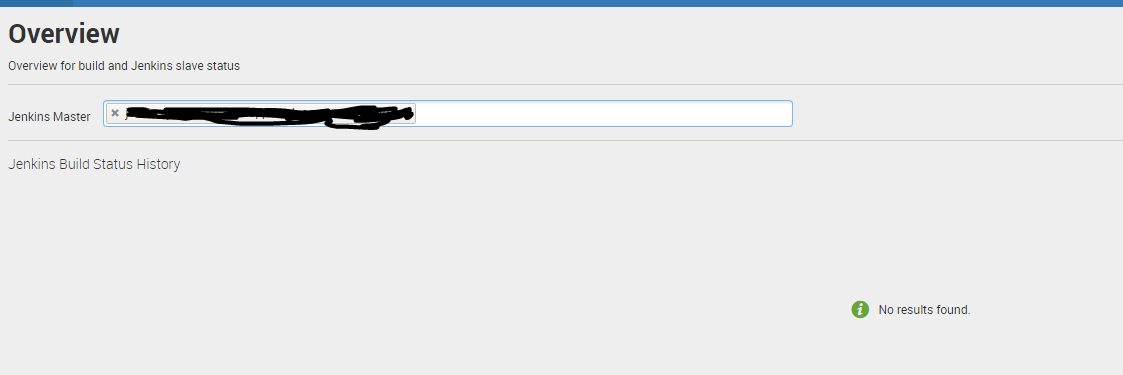
Overview - Visualize multiple masters and associated slaves in a single page. View build status trends and be able to drill down and get details information about any build.
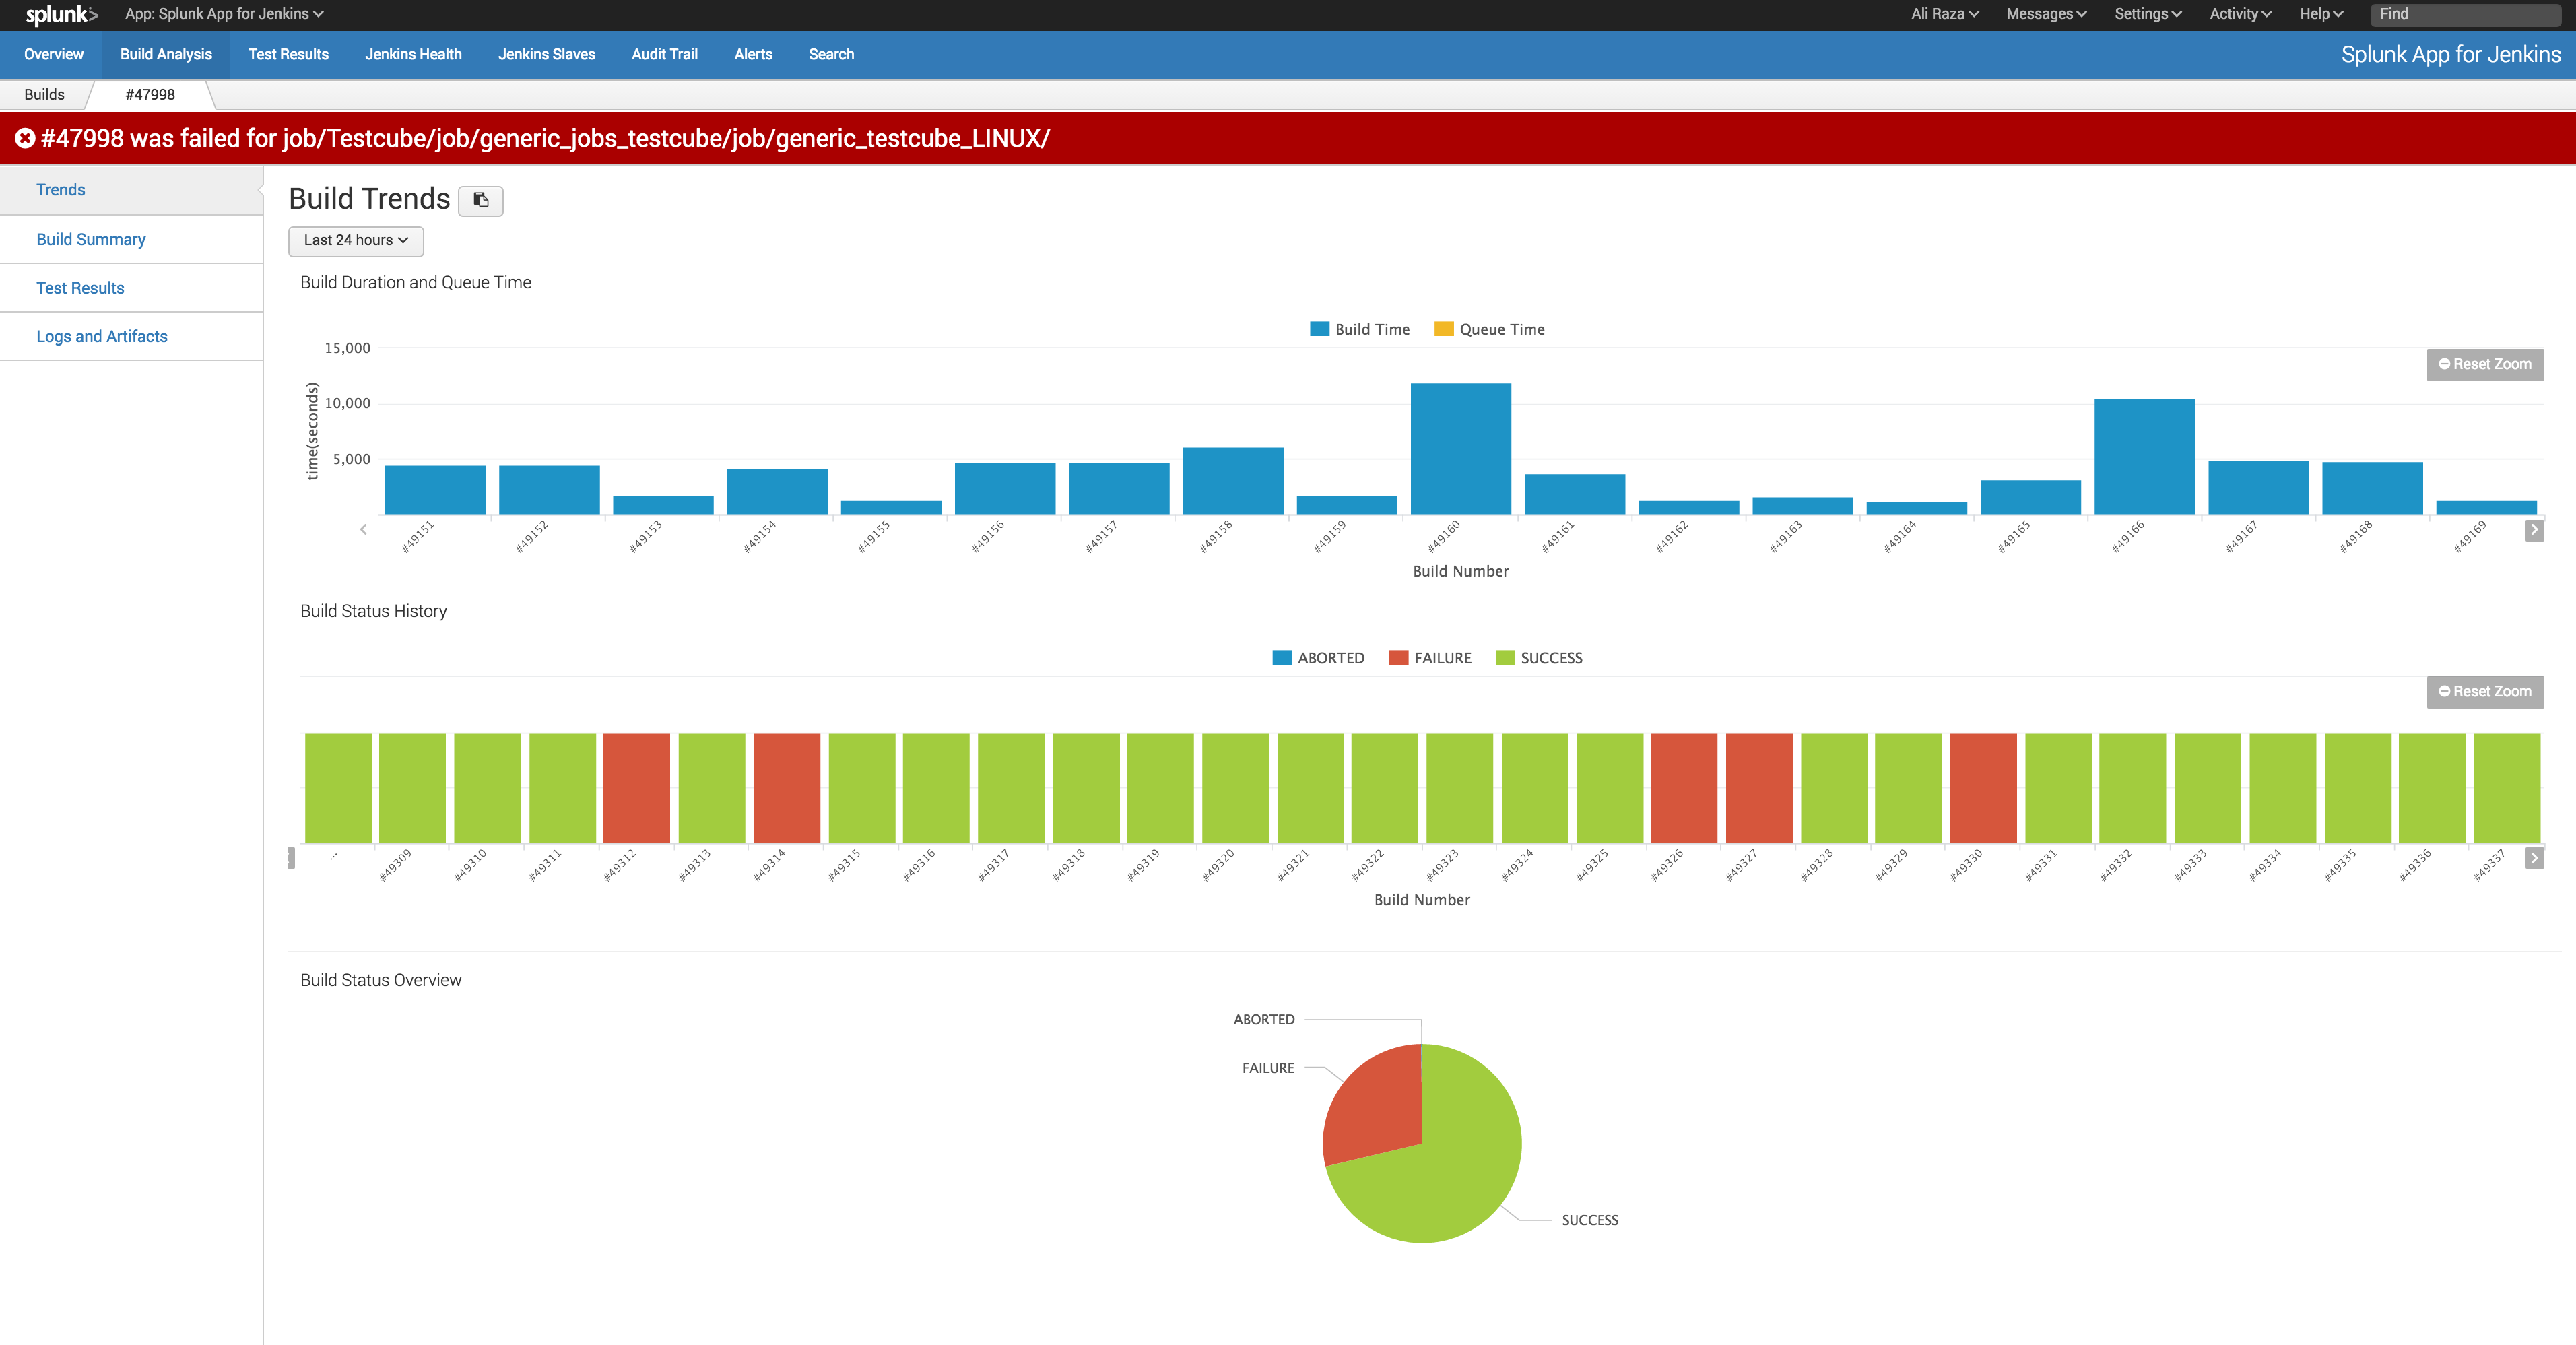
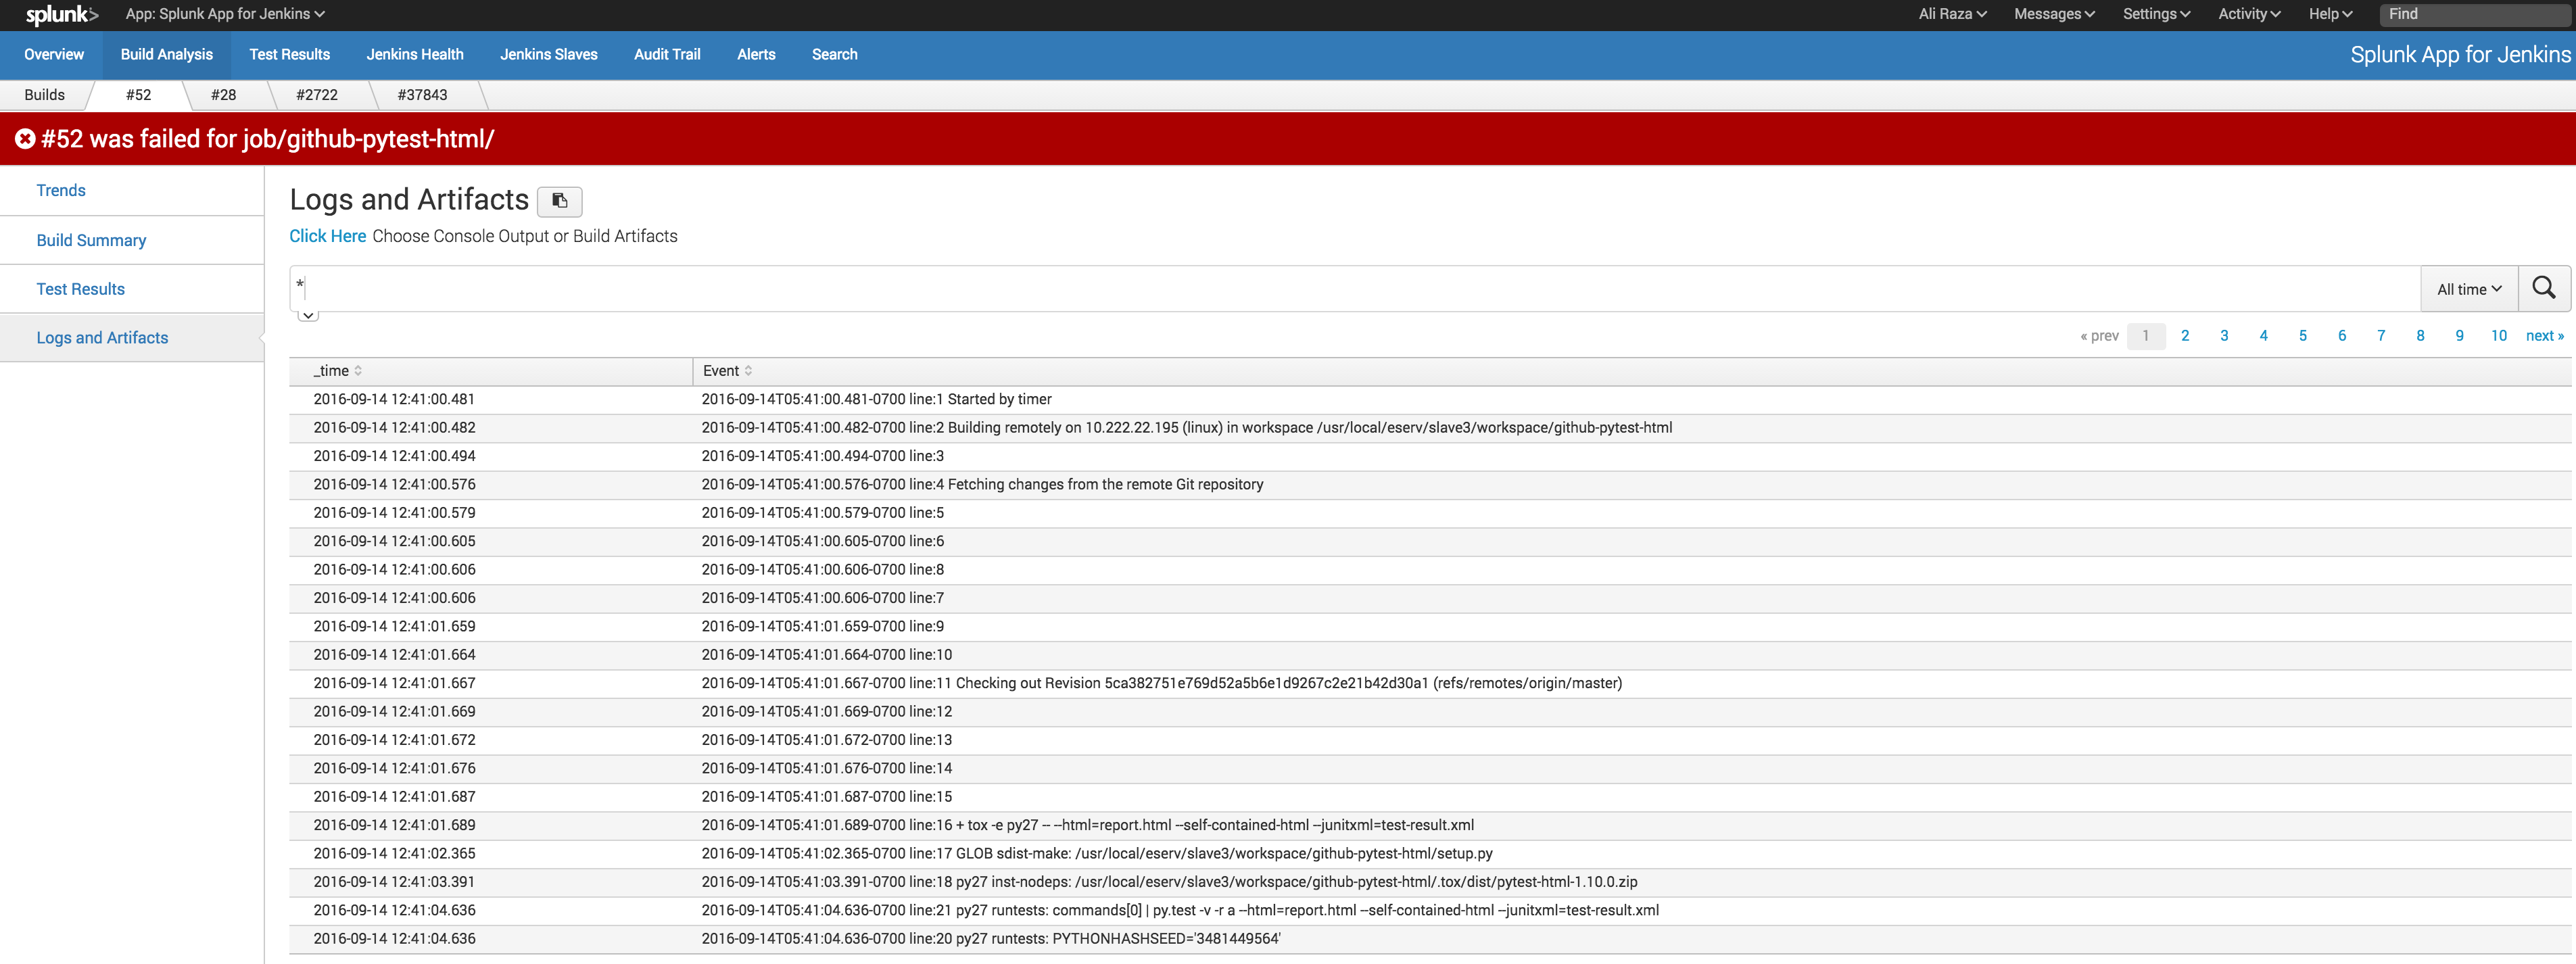
Build Analysis - Easily find any Jenkins build using a variety of easy to use filters. View build summary or drill down to see build status trends, build time and queue time analysis, tests pass/fail trends, test runtime distribution, and console logs couple with Splunk's powerful search interface.
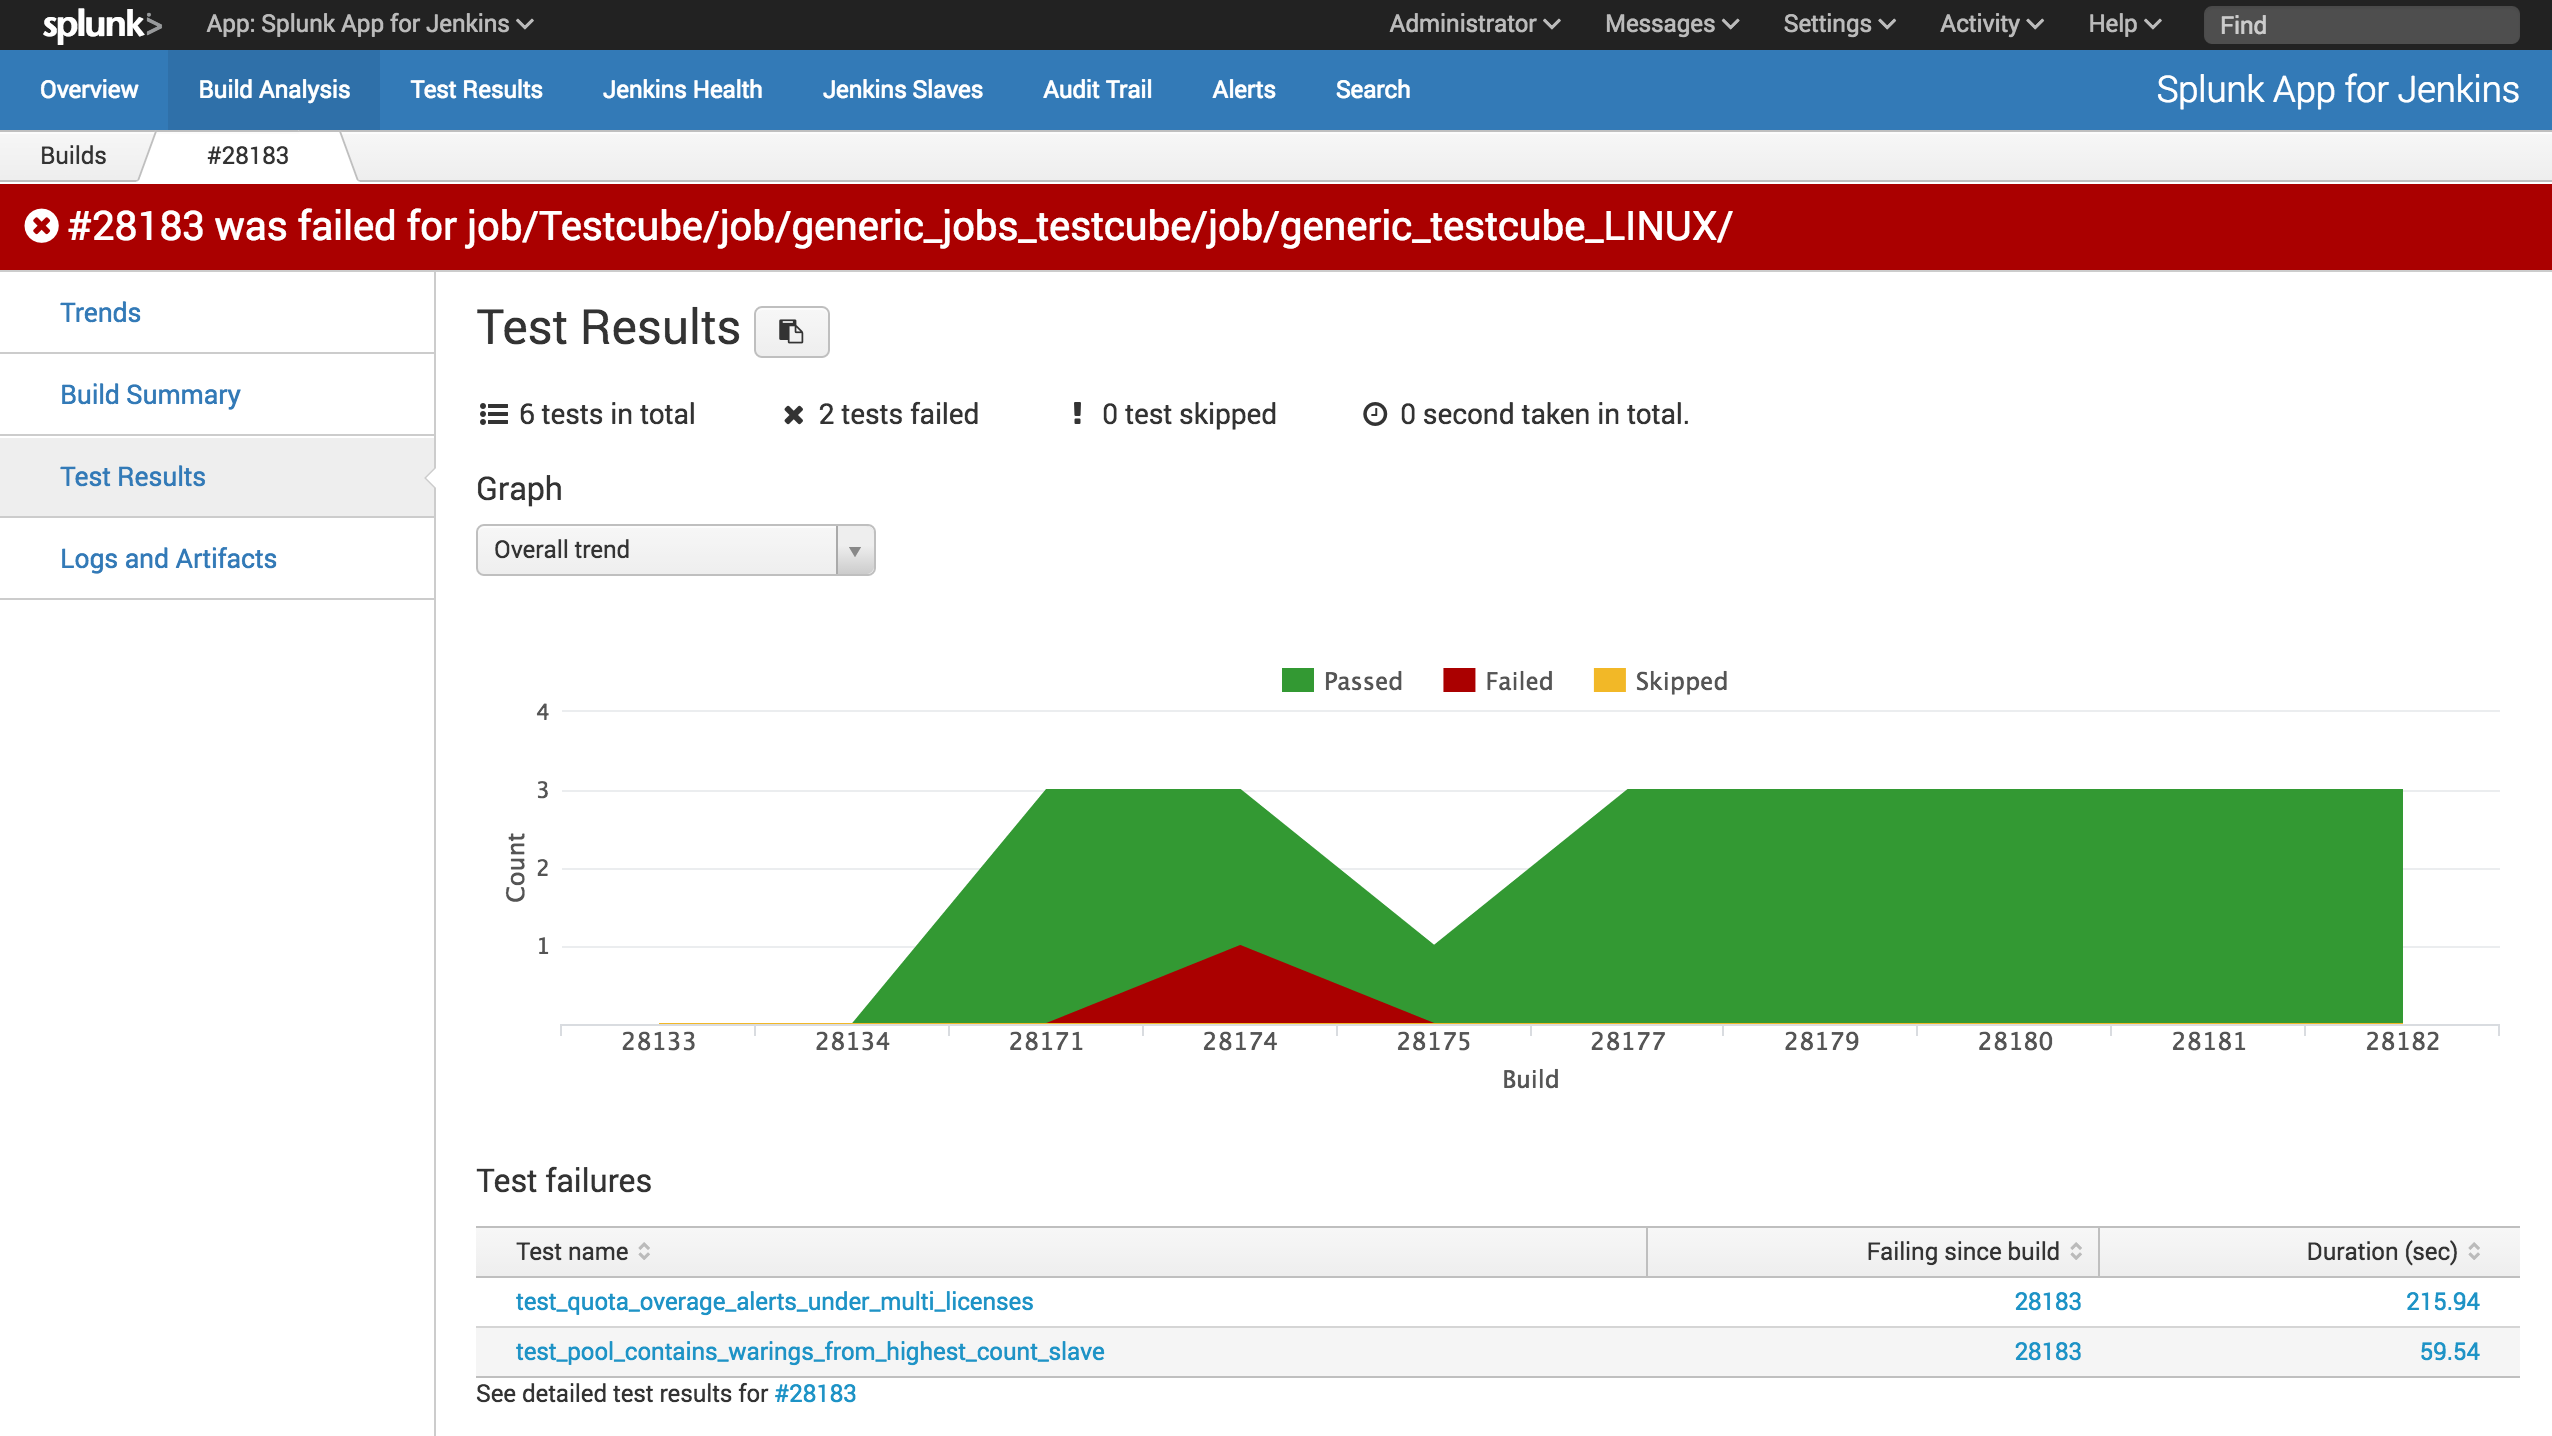
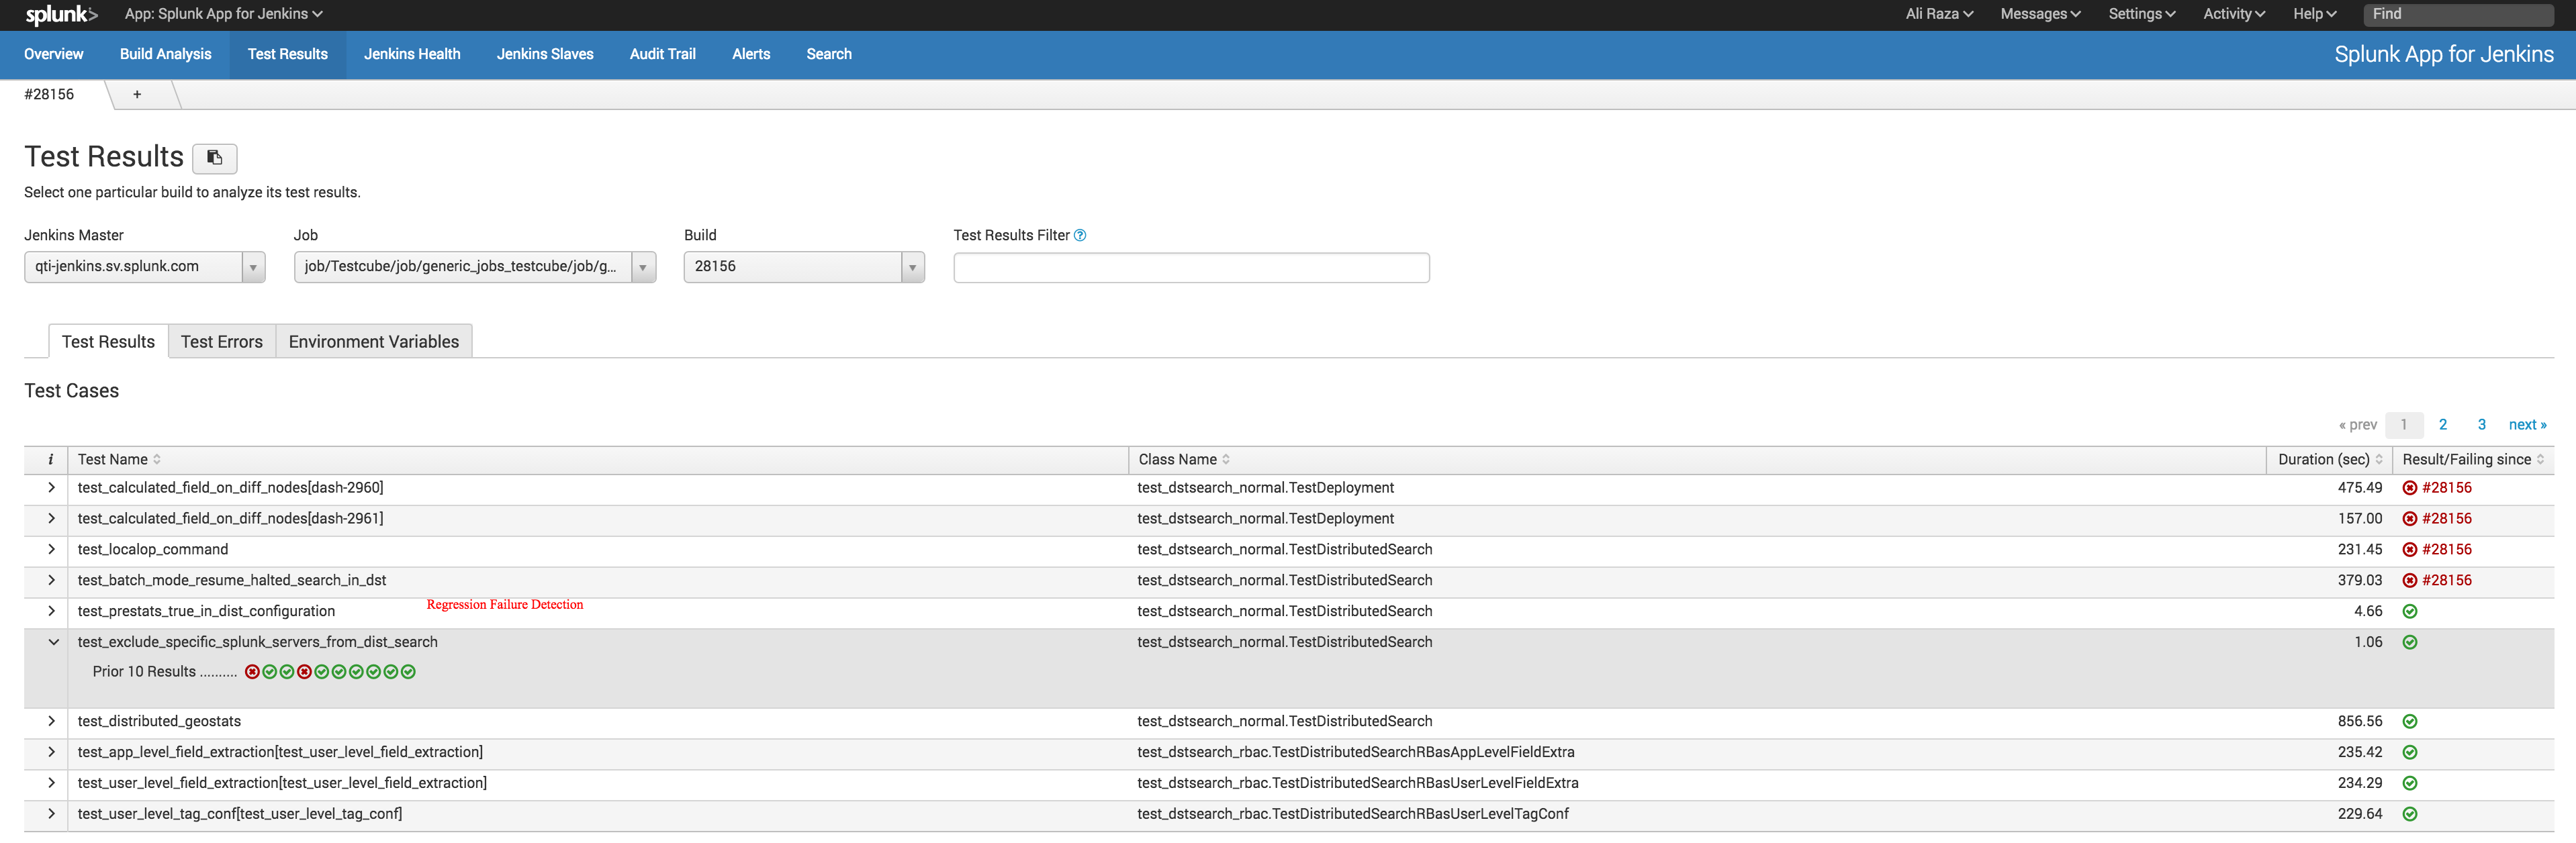
Test Results - If you are a test engineer and spend countless hours looking at test results in Jenkins, you will love this feature. Test Results shows all the failing tests with stack traces, flags regression failures, groups test failures by errors, captures Jenkin's environment variables, and provides nifty filters to find tests with long run times, particular errors, testsuites, etc.
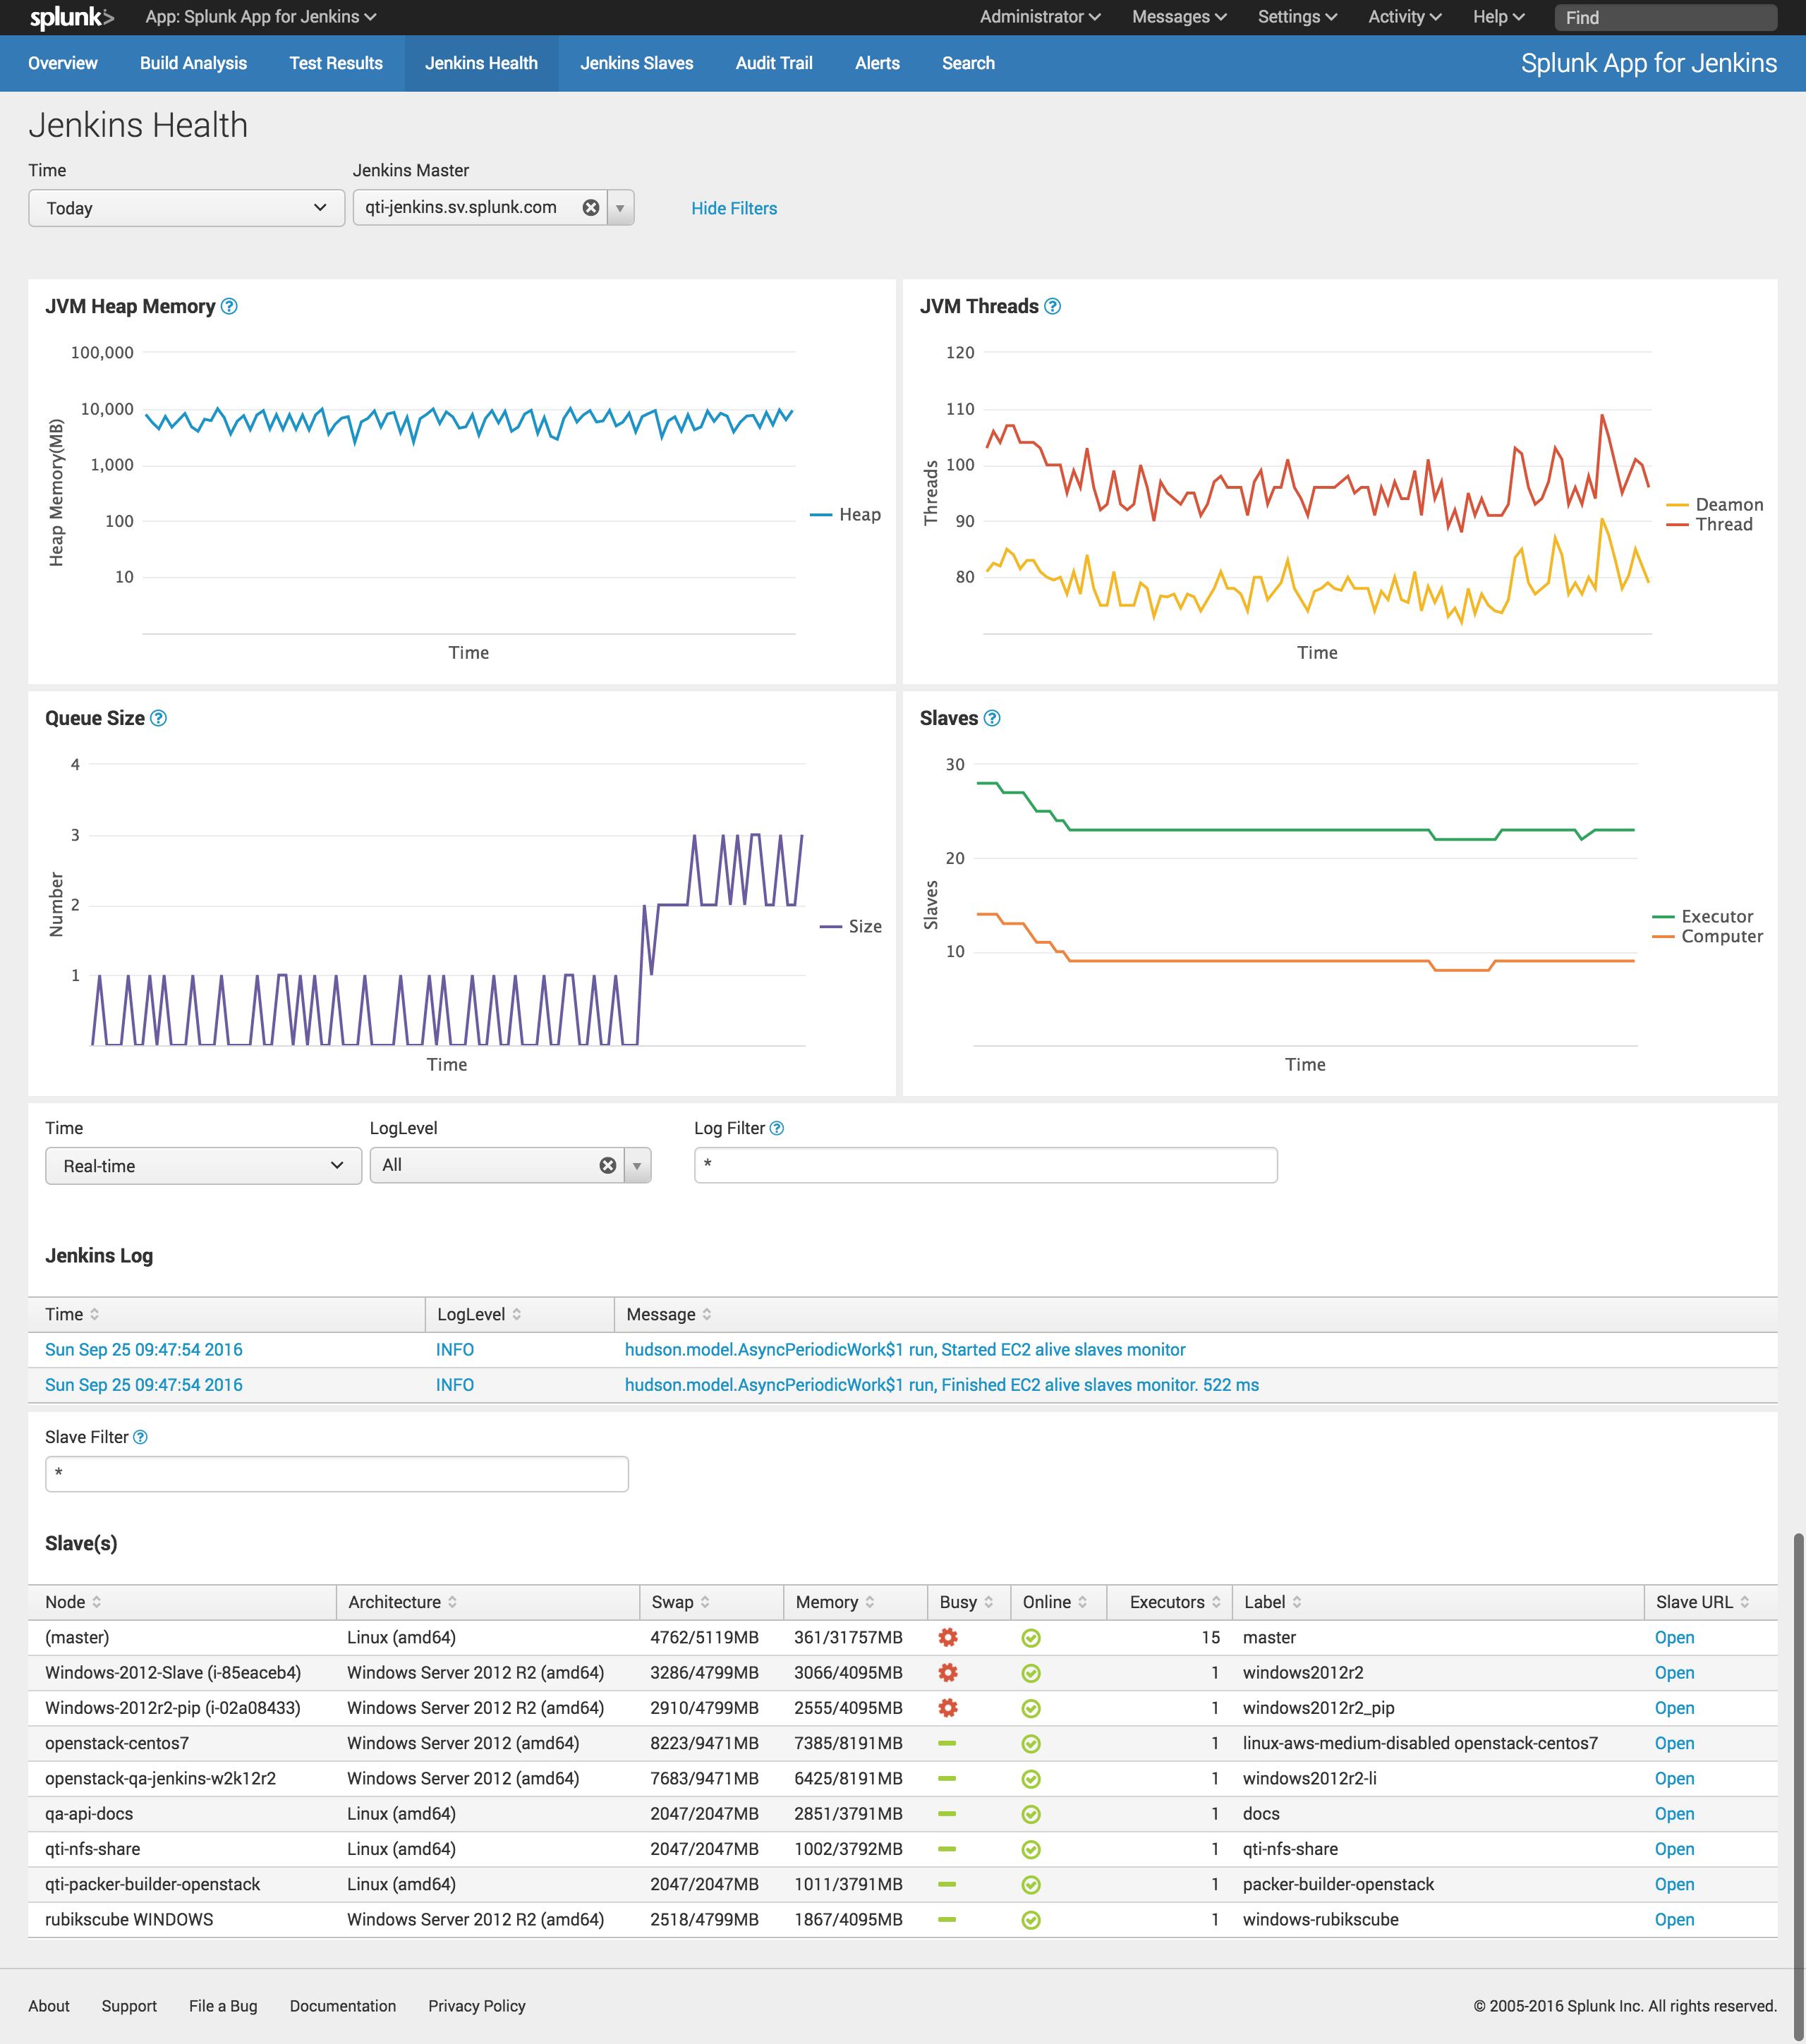
Jenkins Health - Splunk Jenkins Apps captures Jenkins internal JVM information as well as keys metrics like queue size, executors and slaves stats, Jenkins master logs, and Jenkins slave stats. All this information is captured in real-time, allowing you to quickly discover hard to find issues and fix them before they become a bottleneck for development teams. No more ssh-ing into Jenkins systems to find issues.
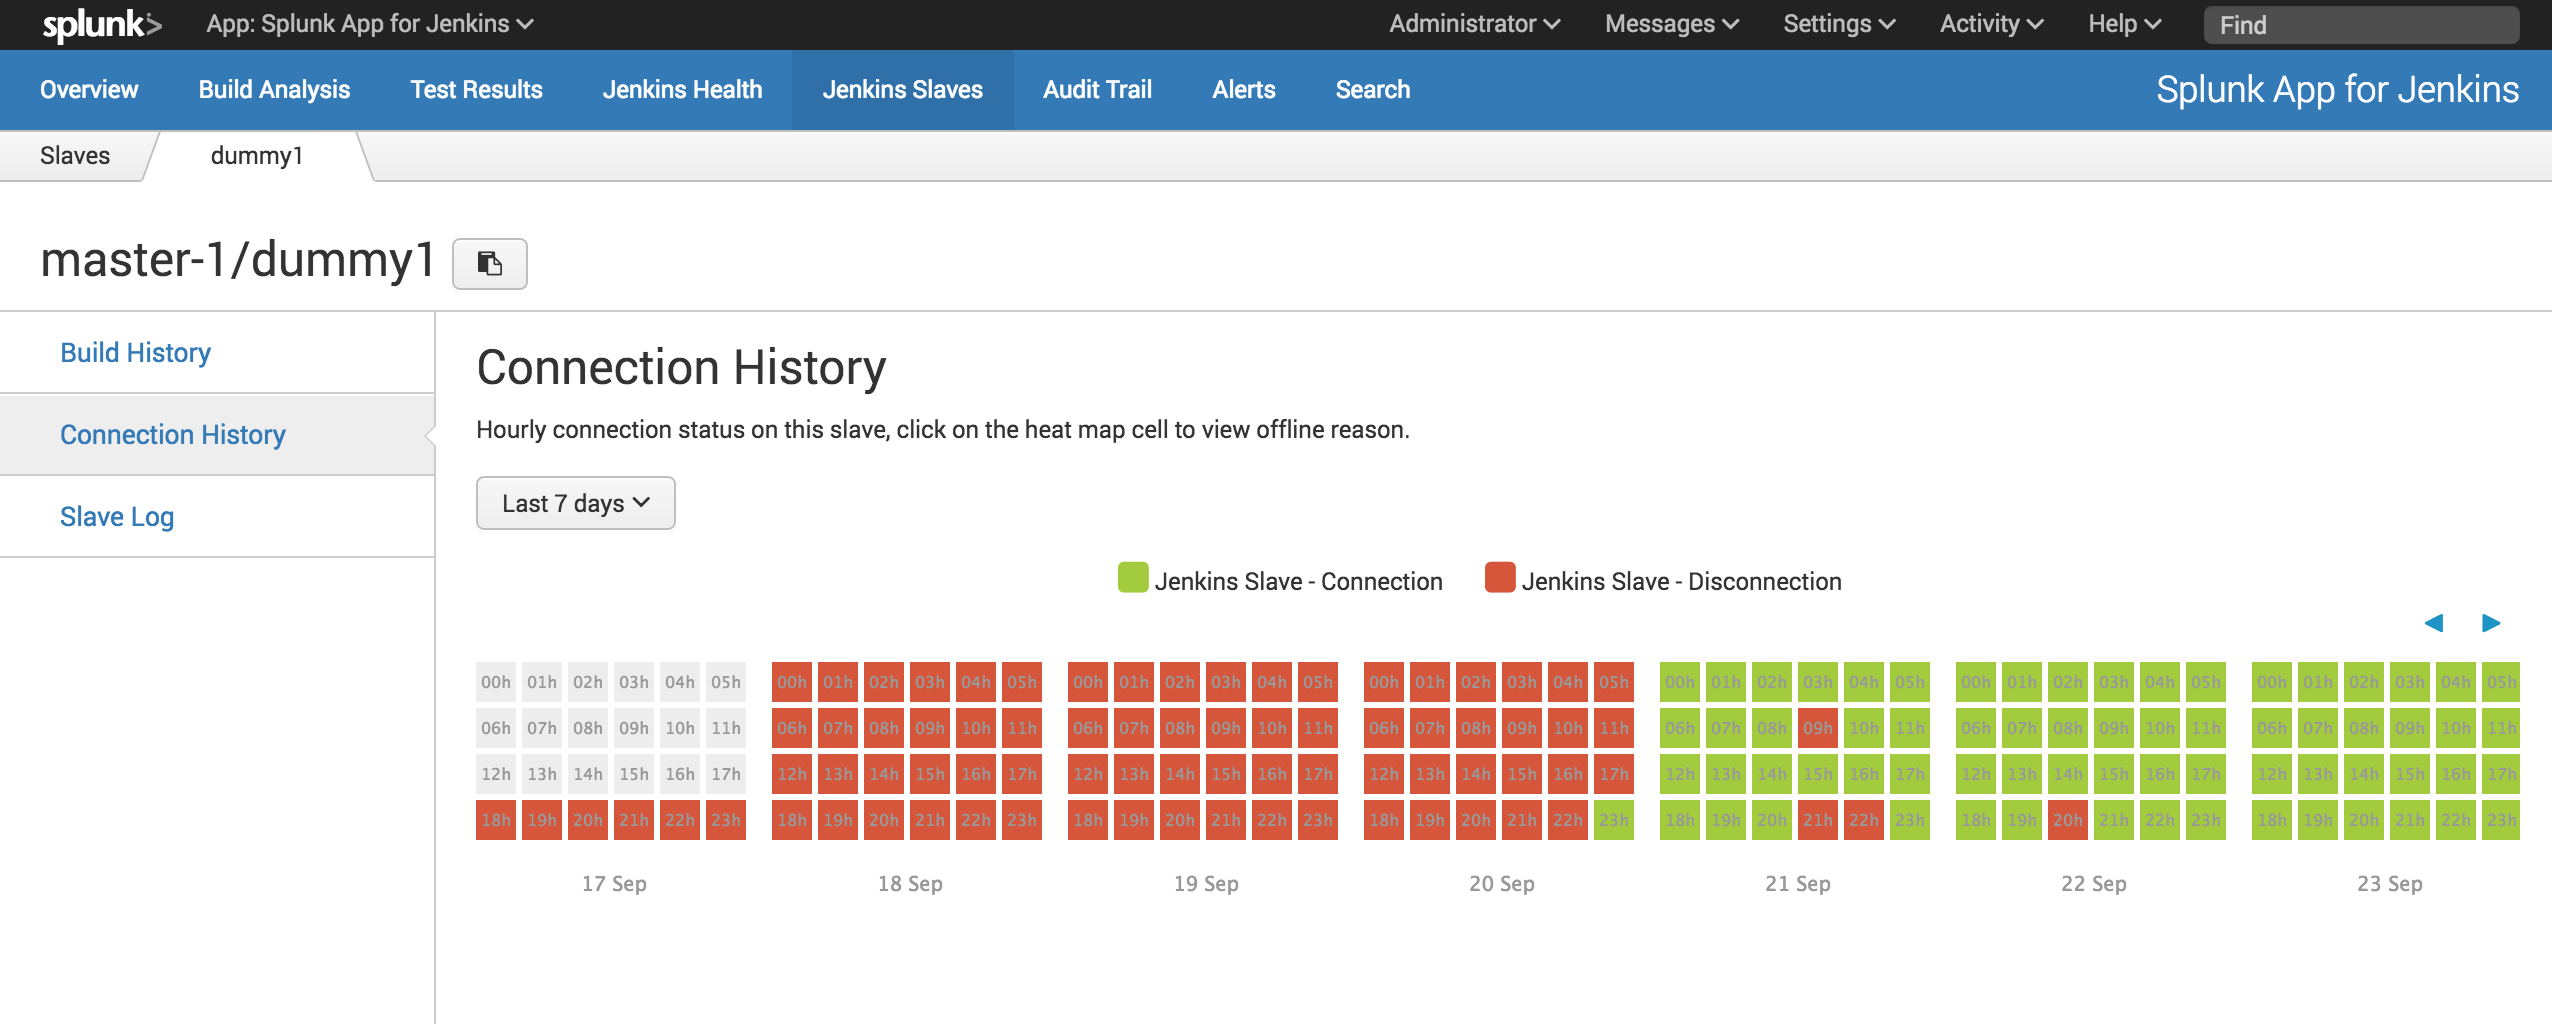
Jenkins Slaves - Analyze all activity on a particular slave. View builds executed on a slave, view real-time slave logs, build activity across all slaves, and check connection history to find out unstable Jenkins slaves. This feature is extremely helpful in identifying problematic components in a Jenkins cluster and optimizing your team's throughput.
Audit Trail - Audit trail feature allows you to see who has logged into your Jenkins system and done any activity like starting/aborting/changing jobs. You can also see what configs have been changed by some user and can view the config xml directly in Splunk. This feature is particularly useful for organization with security and compliance use cases.
To Contribute
- clone the repo and update code
- start splunk, you can get a free trail version from Splunk
- run
$ mvn clean verify -Dsplunk-host=localhost -Dsplunk-username=admin -Dsplunk-passwd=changemeto run tests using local splunk instance. - send pull requests
Docker Demo Image
curl -s -L https://raw.githubusercontent.com/fengxx/docker-splunk-app-jenkins/master/demo.sh | sh
FAQ
How can I send historical data prior to the time plugin get installed
Access <jenkins_url>/script, and execute the groovy code (update the time range if needed).
def dataParser=new java.text.SimpleDateFormat("yyyy-MMM-dd HH:mm")
def startTime=0
def endTime=dataParser.parse("2016-OCT-26 13:24").getTime()
def archiver=new com.splunk.splunkjenkins.utils.BuildInfoArchiver()
archiver.run(startTime, endTime)
I got "Server is busy, maybe caused by blocked queue", what can I do
Please try below options
a) Adjust splunk queue size to a larger value, such as 5MB. Edit SPLUNK_HOME/etc/system/local/server.conf and add
[queue]
maxSize = 5MB
b) Adjust console text/log file buffer size, such as 10KB, Add below line to Jenkins startup script
-Dsplunkins.buffer=10240
I am using upstream/downstream jobs, how can I consolidate the test results to root trigger job?
You can use "Customize Event Processing Script"
Changelog
1.8.1 (August 20, 2019)
- fix JENKINS-58866 Splunk plugin not sending json files
1.8.0 (August 14, 2019)
- fix groovy synatx validation security issue
- update minium jenkins version requirement to 2.60.3, script-security to 1.61
1.7.4 (June 14, 2019)
- fix disabled check issue for jenkins pipeline step sendSplunkConsoleLog
1.7.3 (May 28, 2019)
- Support RFC 6265 compliant cookie policy thanks to Jonas Linde
- Add splunkins.verifySSL property to toggle SSL certification verification on or off
1.7.2 (May 20, 2019)
- JENKINS-57410 connection leak after clicking 'Test Connection' button
- respect TestNG is-config settings (beforeClass, beforeMethod) for counting test methods
- add splunkins.allowConsoleLogPattern and splunkins.ignoreConfigChangePattern
1.7.1 (Dec 7, 2018)
truncate single line text at 100000 (a sign of garbage data) to get in align with splunk source type text:jenkins, it can be adjusted via splunkins.lineTruncate system property
- add user authenticated log information
1.7.0 (August 20, 2018)
- support multiple http event collector(HEC) hosts which are separated by comma
- optimize event congestion handling
- allow garbage collector to release unsent log under memory demand, to prevent OOM
- allow user to adjust log queue size via -Dcom.splunk.splunkjenkins.utils.SplunkLogService.queueSize=x
- add LogConsumer thread alive check
- prefer tls 1.2