
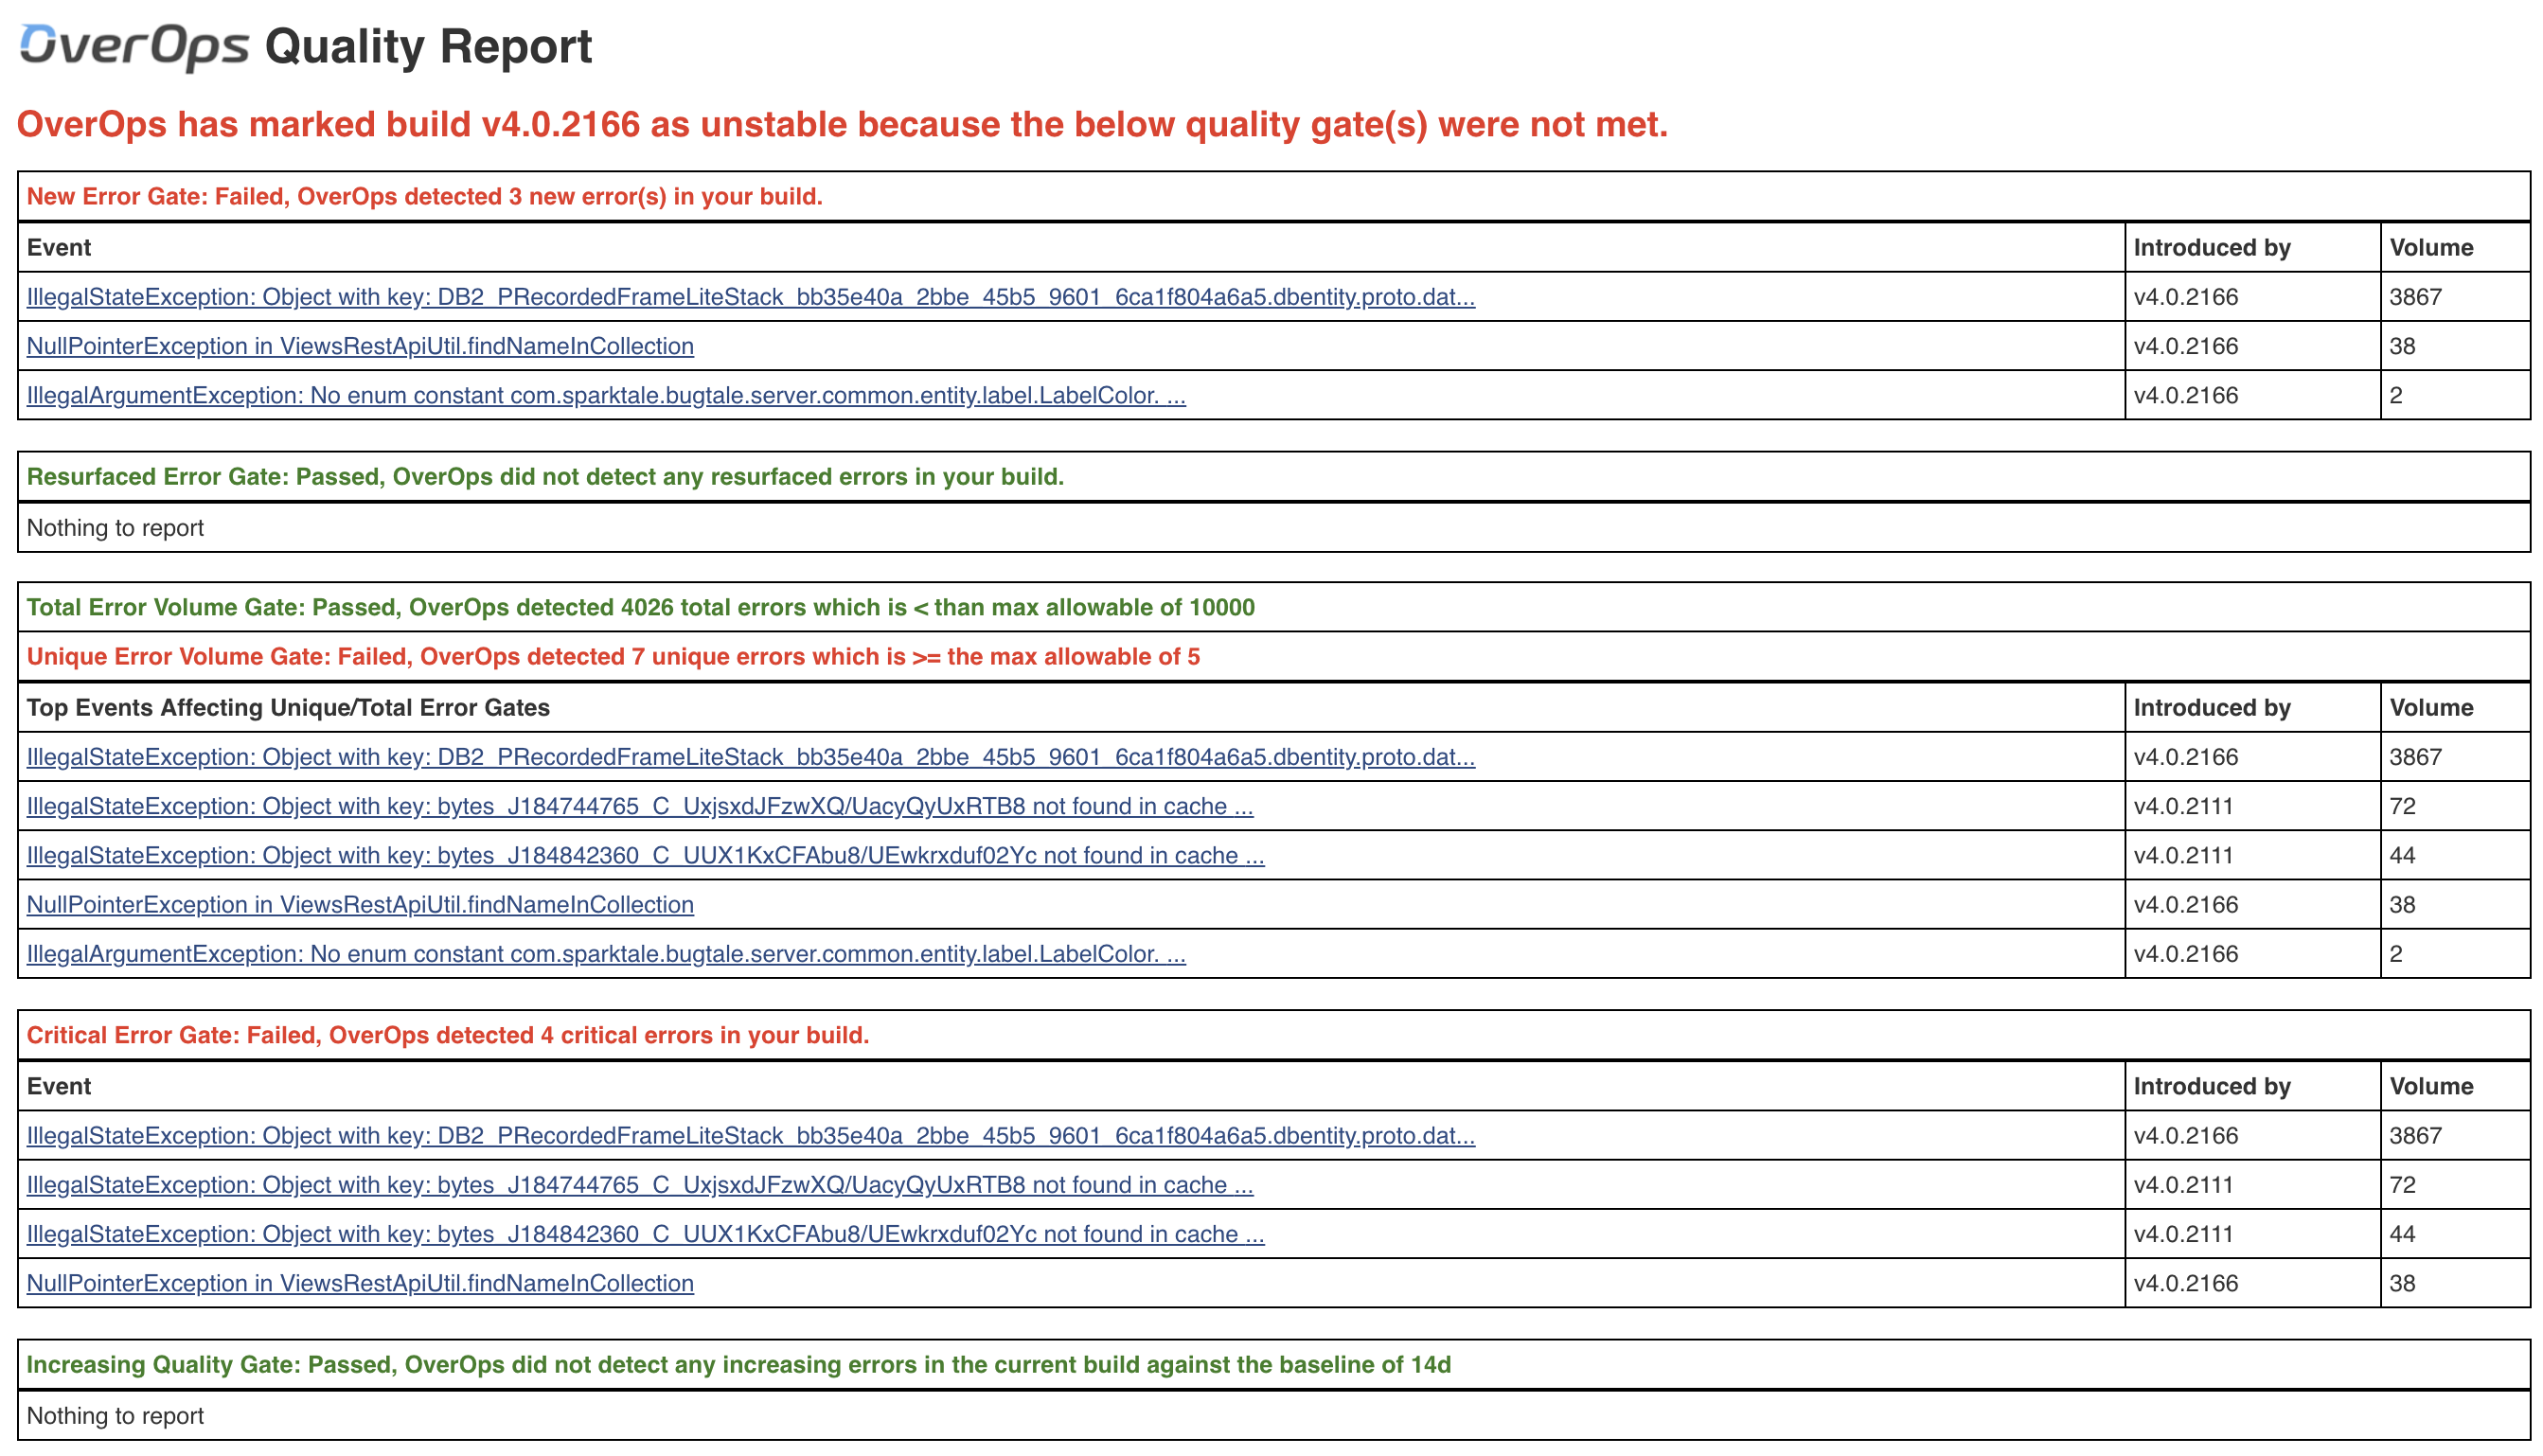
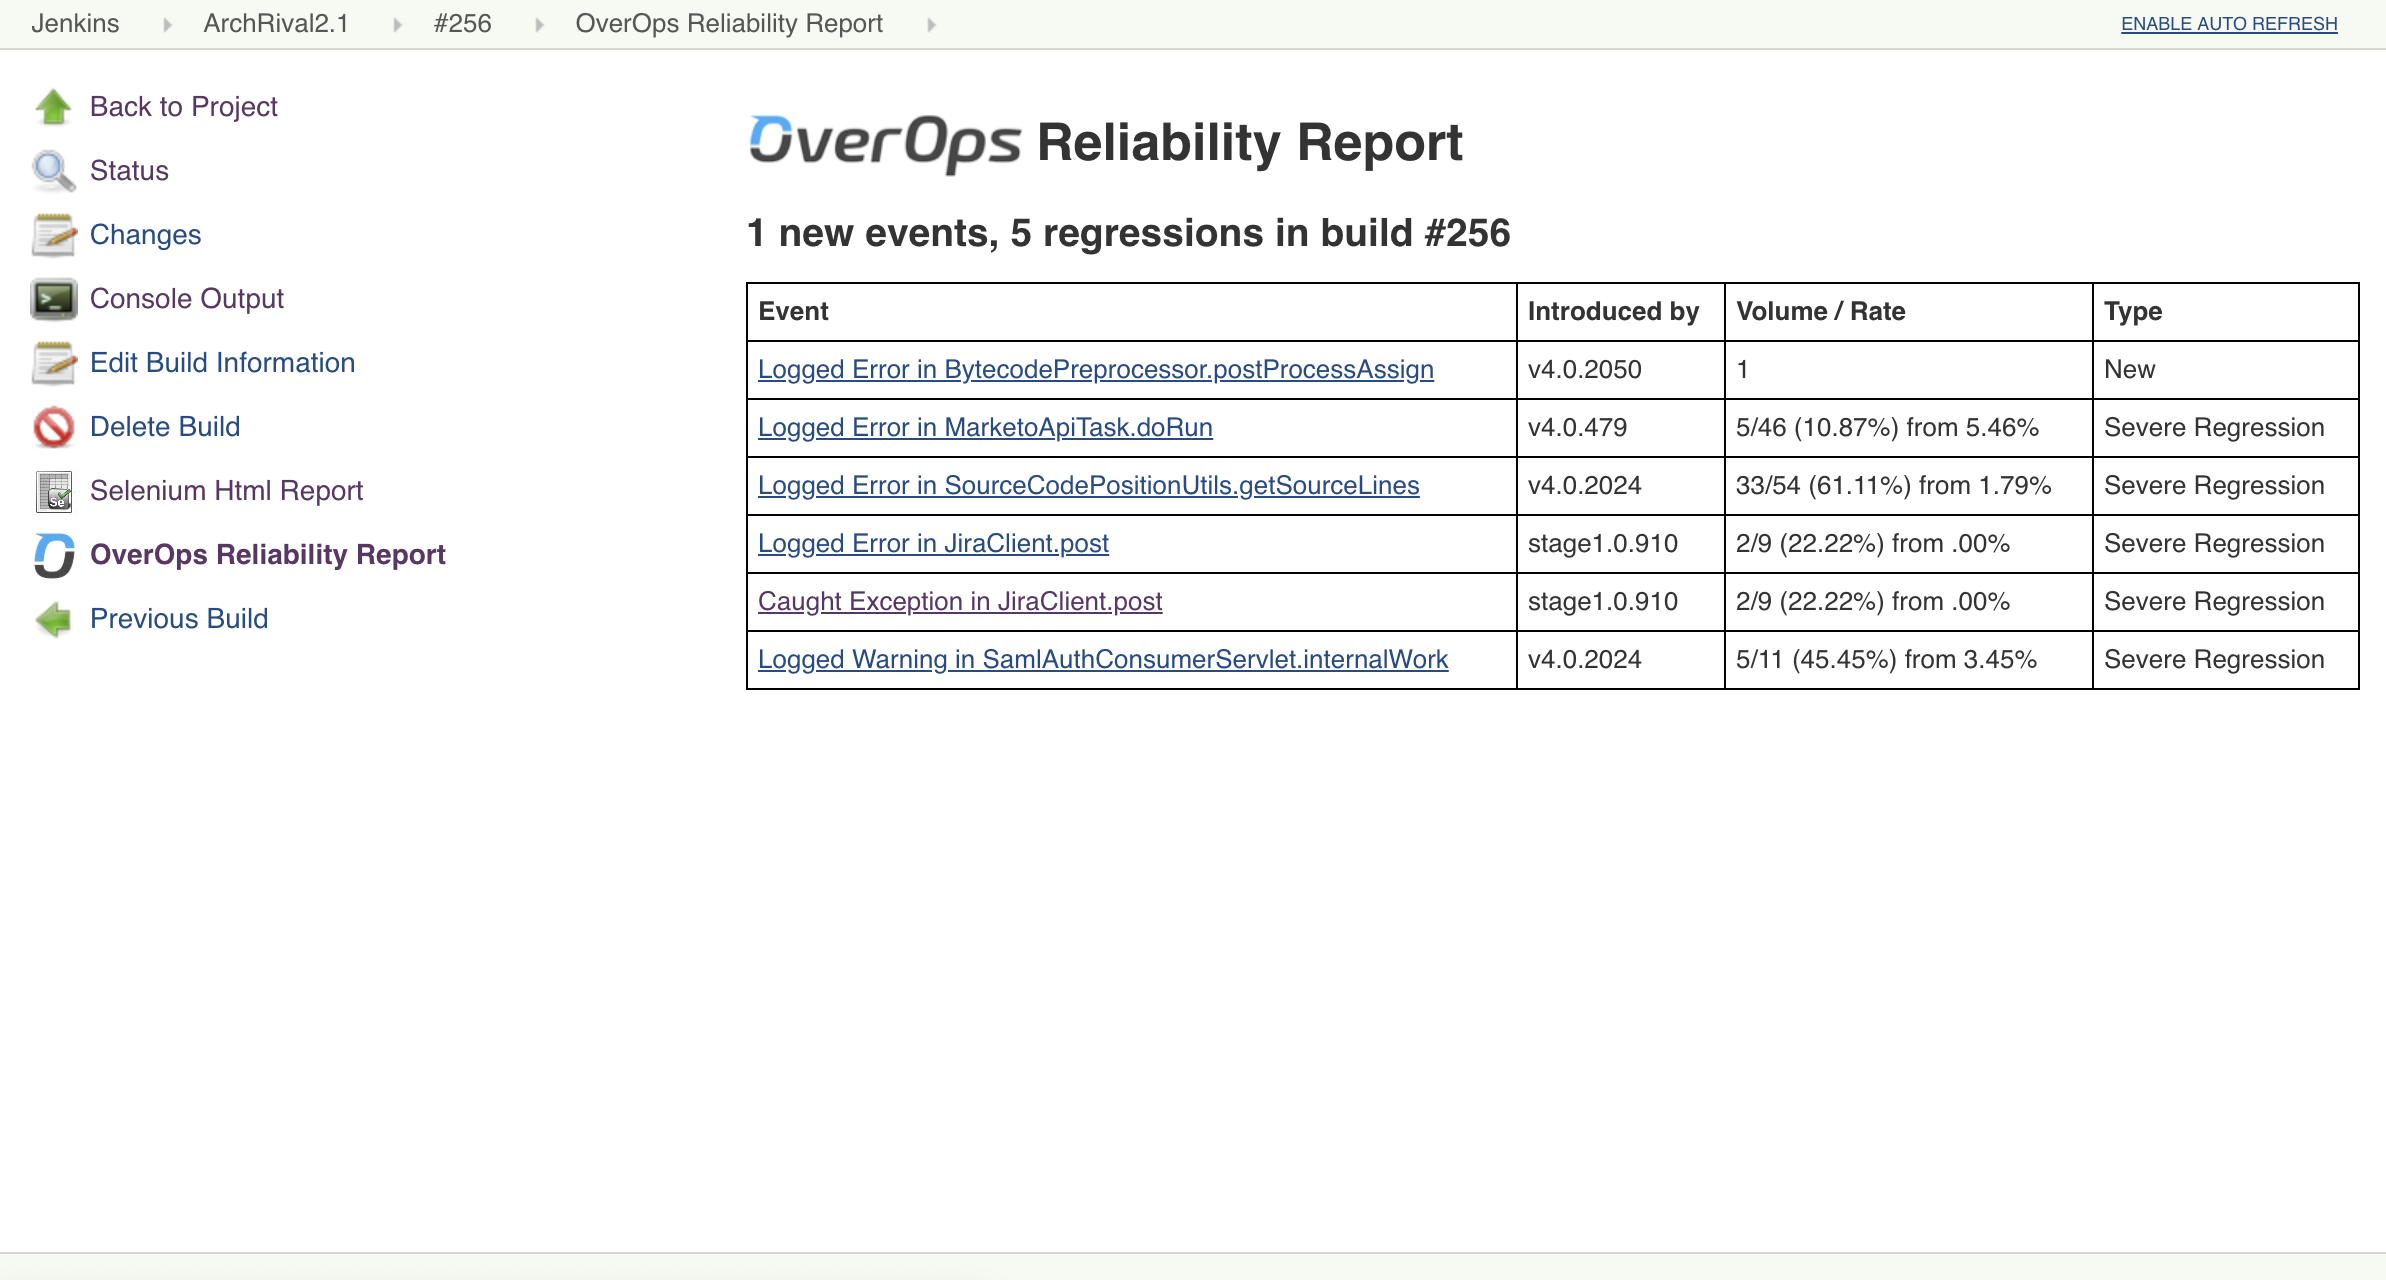
This plugin provides a mechanism for applying OverOps severity assignment and regression analysis to new builds to allow application owners, DevOps engineers, and SREs to determine the quality of their code before promoting it into production.
Run this plugin as a post build step after all other testing is complete to generate a Reliability Report that will determine the stability of the build. From the Reliability Report you can drill down into each specific error using the OverOps Automated Root Cause analysis screen to solve the issue.
For more information about the plugin, quality gates, and for regression testing examples, see the Jenkins Plugin Guide.
Find this project on GitHub: https://github.com/jenkinsci/overops-query-plugin
Installation
Prerequisites
- Jenkins 2.43 running on Java 1.8 or later
- OverOps installed on the designated environment
Install the OverOps Query Plugin through the Plugin Manager. From the Jenkins Dashboard, select Manage Jenkins → Manage Plugins → Available → scroll down to OverOps Query Plugin.
Global Configuration
After installing the plugin, configure it to connect to OverOps.
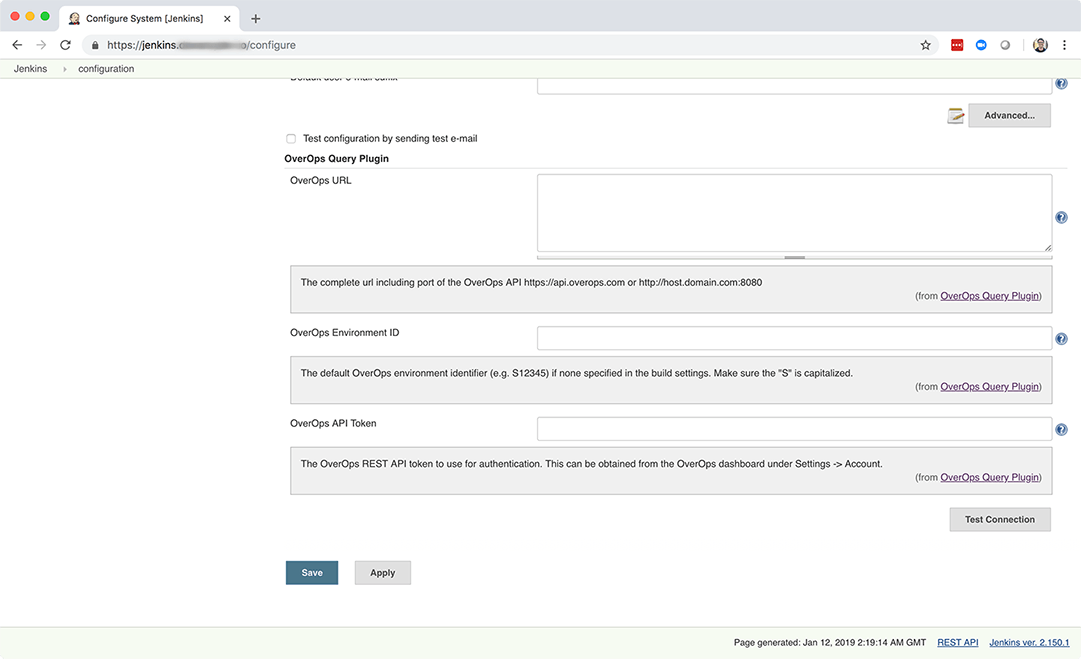
From the Jenkins Dashboard, select Manage Jenkins → Configure System → scroll down to OverOps Query Plugin.

OverOps URL
The complete URL of the OverOps API, including port. https://api.overops.com for SaaS or http://host.domain.com:8080 for on prem.
OverOps Environment ID
The default OverOps environment identifier (e.g. S12345) if none is specified in the build settings. Make sure the "S" is capitalized.
OverOps API Token
The OverOps REST API token to use for authentication. This can be obtained from the OverOps dashboard under Settings → Account.
Testing
Click Test Connection to show a count of available metrics. If the count shows 0 measurements, credentials are correct but database may be wrong. If credentials are incorrect you will receive an authentication error.
Job Post Build Configuration
Choose a project, then select Configure → Post-build Actions → scroll down to Query OverOps
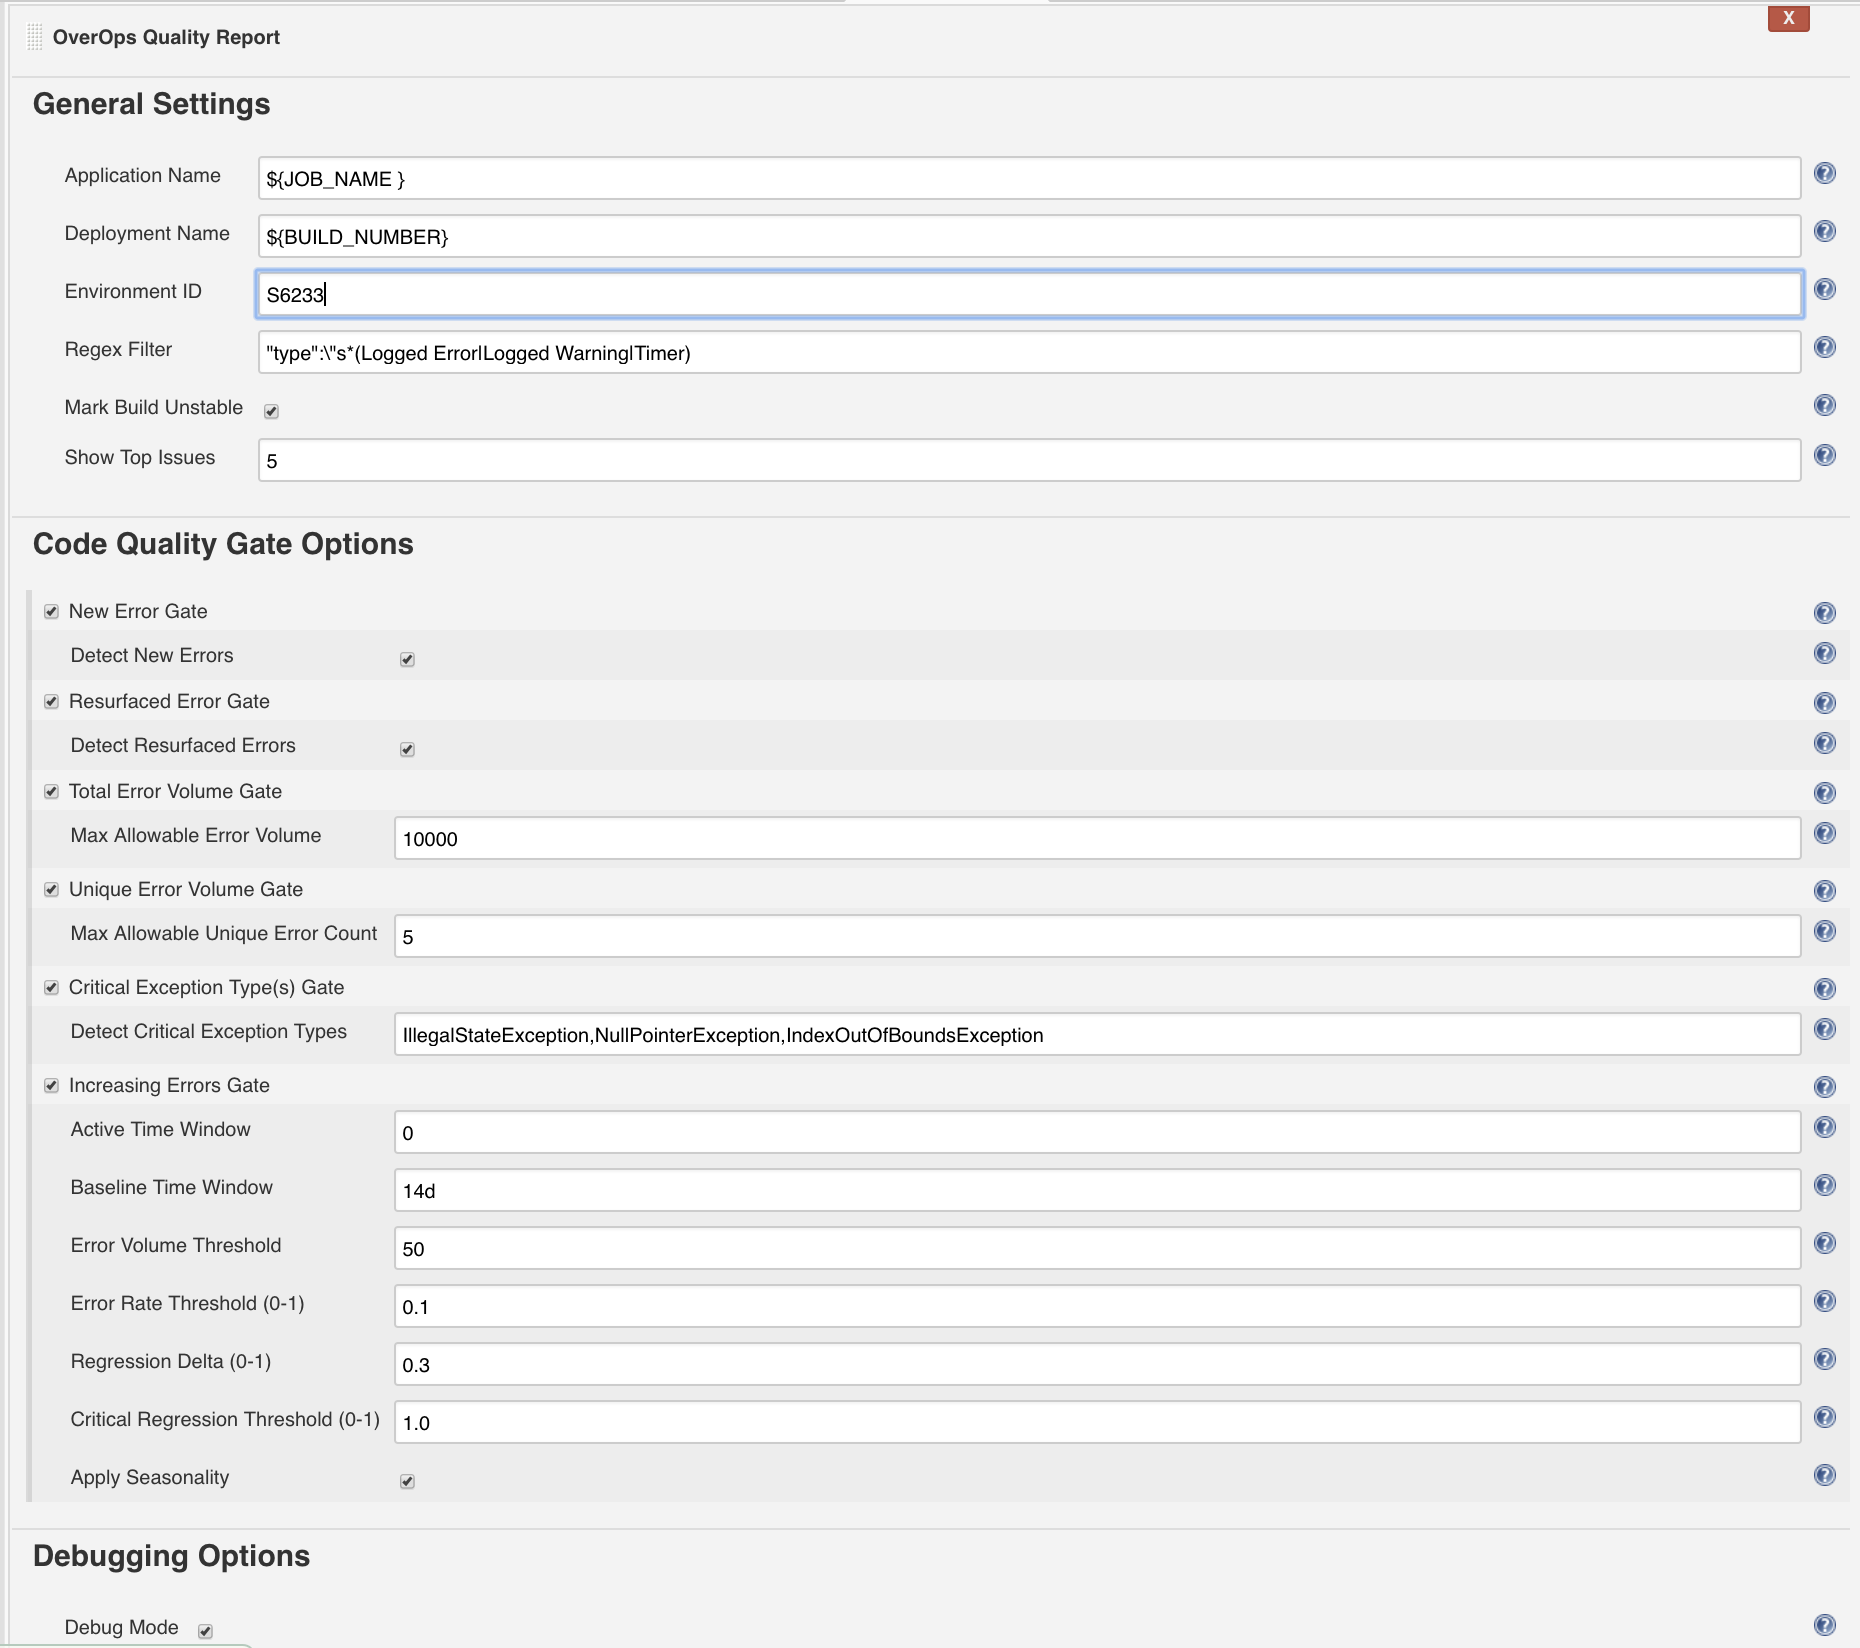
Application Name
(Optional) Application Name as specified in OverOps
- If populated, the plugin will filter the data for the specific application in OverOps.
- If blank, no application filter will be applied in query.
Example:
${JOB_NAME }
Deployment Name
(Optional) Deployment Name as specified in OverOps or use Jenkins environment variables.
Example:
${BUILD_NUMBER} or ${JOB_NAME }-${BUILD_NUMBER}
- If populated, the plugin will filter the data for the specific deployment name in OverOps
- If blank, no deployment filter will be applied in the query.
Environment ID
The OverOps environment identifier (e.g S4567) to inspect data for this build. If no value is provided here, the value provided in the global Jenkins plug settings will be used.
Regex Filter
A way to filter out specific event types from affecting the outcome of the OverOps Reliability report.
- Sample list of event types, Uncaught Exception, Caught Exception,|Swallowed Exception, Logged Error, Logged Warning, Timer
- This filter enables the removal of one or more of these event types from the final results.
- Example filter expression with pipe separated list-
"type":\"s*(Logged Error|Logged Warning|Timer)
Mark Build Unstable
If checked the build will be marked unstable if any of the above gates are met.
Show Top Issues
Prints the top X events (as provided by this parameter) with the highest volume of errors detected within the active time window, This is useful when used in conjunction with Max Error Volume to identify the errors which caused a build to fail.
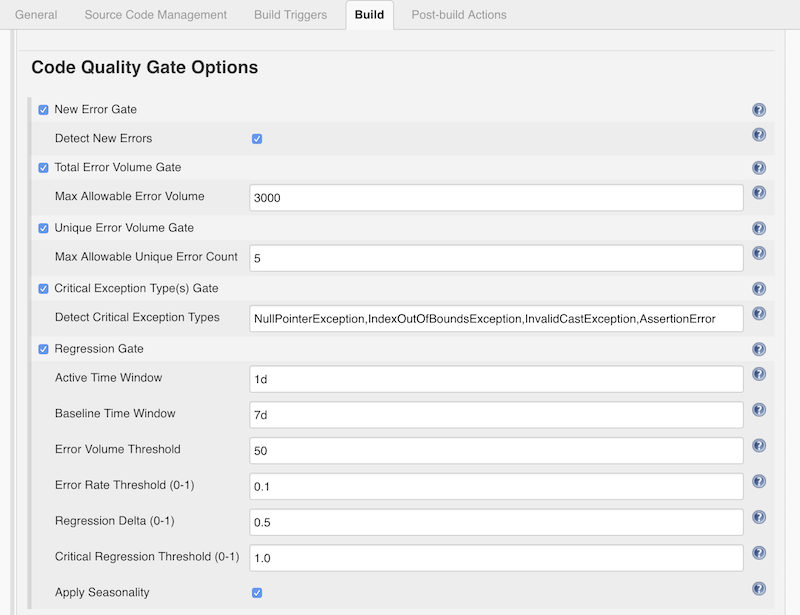
Quality Gates
New Error Gate
If any new errors is detected, the build will be marked as unstable.
Resurfaced Error Gate
If any resurfaced errors is detected, the build will be marked as unstable.
Total Error Volume Gate
Set the max total error volume allowed. If exceeded the build will be marked as unstable.
Unique Error Volume Gate
Set the max total error volume allowed. If exceeded the build will be marked as unstable.
Critical Exception Types Gate
A comma delimited list of exception types that are deemed as severe regardless of their volume. If any events of any exceptions listed have a count greater than zero, the build will be marked as unstable. Blank to skip this test.
Example:
NullPointerException,IndexOutOfBoundsException
Increasing Errors Gate
Combines the following parameters:
- Event Volume Threshold
- Event Rate Threshold
- Regression Delta
- Critical Regression Threshold
- Apply Seasonality
Active Time Window (d - day, h - hour, m - minute)
The time window inspected to search for new issues and regressions. Set to zero to use the Deployment Name (which would be the current build).
- Example: 1d would be one day active time window.
Baseline Time Window (d - day, h - hour, m - minute)
The time window against which events in the active window are compared to test for regressions. If this gate is used, baseline time window is required.
- Example: 14d would be a two week baseline time window.
Event Volume Threshold
The minimal number of times an event of a non-critical type (e.g. uncaught) must take place to be considered severe.
- If a New event has a count greater than the set value, it will be evaluated as severe and could break the build if its event rate is above the Event Rate Threshold.
- If an Existing event has a count greater than the set value, it will be evaluated as severe and could break the build if its event rate is above the Event Rate Threshold and the Critical Regression Threshold.
- If any event has a count less than the set value, it will not be evaluated as severe and will not break the build.
Event Rate Threshold (0-1)
The minimum rate at which event of a non-critical type (e.g. uncaught) must take place to be considered severe. A rate of 0.1 means the events is allowed to take place <= 10% of the time.
- If a New event has a rate greater than the set value, it will be evaluated as severe and could break the build if its event volume is above the Event Volume Threshold.
- If an Existing event has a rate greater than the set value, it will be evaluated as severe and could break the build if its event volume is above the Event Volume Threshold and the Critical Regression Threshold.
- If an event has a rate less than the set value, it will not be evaluated as severe and will not break the build.
Regression Delta (0-1)
The change in percentage between an event's rate in the active time span compared to the baseline to be considered a regression. The active time span is the Active Time Window or the Deployment Name (whichever is populated). A rate of 0.1 means the events is allowed to take place <= 10% of the time.
- If an Existing event has an error rate delta (active window compared to baseline) greater than the set value, it will be marked as a regression, but will not break the build.
Critical Regression Threshold (0-1)
The change in percentage between an event's rate in the active time span compared to the baseline to be considered a critical regression. The active time span is the Active Time Window or the Deployment Name (whichever is populated). A rate of 0.1 means the events is allowed to take place <= 10% of the time.
- If an Existing event has an error rate delta (active window compared to baseline) greater than the set value, it will be marked as a severe regression and will break the build.
Apply Seasonality
If peaks have been seen in baseline window, then this would be considered normal and not a regression. Should the plugin identify an equal or matching peak in the baseline time window, or two peaks of greater than 50% of the volume seen in the active window, the event will not be marked as a regression.
Debug Mode
If checked, all queries and results will be displayed in the OverOps reliability report. For advanced debugging purposes only.
Visit overops.com to learn more about OverOps.