The Application Automation Tools plugin for the Jenkins continuous integration server provides a mechanism for executing LoadRunner Controller scenarios as part of a build script. This plugin allows you to trigger a performance test as a build step, and present the results in the Jenkin's user interface.
You can only integrate scenarios which have service level agreements (SLAs). This allows you to quickly determine whether the test passed or failed and if performance was affected.
For additional information, see the online help or blog post about continuous integration with LoadRunner.
Prerequisites
- Install one of the five latest LTS versions of Jenkins, (Click here for a list)
- Install the Jenkins Micro Focus Application Automation Tools plugin.
Set up a job
There are two types of jobs that you can create: FreeStyle or Pipeline. FreeStyle is more UI friendly and Pipeline is in a form of code which is more flexible.
- Go to the Jenkins Server home page.
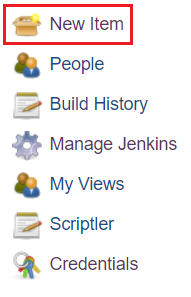
- Click the New Item link or select an existing job.
- Enter an item name (for a new job).
Set up a Freestyle job
- Select Free-style project and click OK.
- In the Project Configuration section, select Restrict where this project can be run, and select the appropriate node. For details, see Create an execution node.
- Scroll down to the Build section.
- Expand the Add build step drop-down and select Execute Micro Focus tests from file system.
- Click the LoadRunner-Specific Settings button and specify the following settings:
- Controller Polling Interval. The interval in seconds by which to poll the Controller for the scenario status. The default is 30 seconds.
- Scenario Execution Timeout. The total time in seconds to allot for the execution of all listed scenarios. After this time, the Controller process will be terminated.
- Errors to Ignore. You can specify which errors to ignore during the run. For example: Error: CPU usage for this load generator has exceeded 80%. Enter each error string on a separate line.
- Analysis Template. Apply a template for the build (path to a .tem file). Leave blank in order to use the default template.
- Display Controller. Display the Controller while the scenario is running.
- In the Tests box, enter a test with its full absolute path, or a folder or MTB containing one or more tests or LoadRunner scenarios. To specify multiple entries, click the down arrow on the right of the field and enter each test path on a separate line. Make sure that the paths are accessible from all machines in the local network.
- Indicate a timeout in seconds after which the job will fail in the Timeout box (optional).
- Click Apply to save your changes and continue with more build steps. Click Save when you are finished adding build steps.
Set up a Pipeline job
- Select Pipeline and click OK.
To restrict where this project can run, first refer to Create an execution node and then see Controlling your build environment.
- Scroll down to the Pipeline section.
- Click Pipeline Syntax.
- In Sample Step select LoadRunnerTest: Run LoadRunner performance scenario tests.
- In the Tests box, enter a test with its full absolute path, or a folder or MTB containing one or more tests or LoadRunner scenarios. To specify multiple entries, click the down arrow on the right of the field and enter each test path on a separate line. Make sure that the paths are accessible from all machines in the local network.
- In Report archive mode follow Set up the Post Build Actions section.
- Follow the Free Style Job section, steps 5 through 7.
- Click Generate Pipeline Script.
- Copy the output beneath the Generate Pipeline Script button.
- Go back to the Pipeline section.
- Paste the copied code into the Script block (read here for how to write pipeline).
- Click Apply to save your changes and continue with more build steps. Click Save when you are finished adding build steps.
Set up the post-build actions
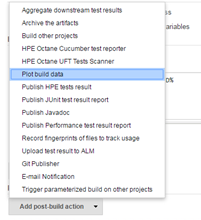
- In the Post-build Actions section, expand the Add post-build action drop-down and select Publish test result.
- Select an archiving option for the test run results:
- Archive test reports for failed tests: Only save test result reports for failed tests.
- Always archive test reports: Always save test result reports.
- Always archive and publish test reports: Always save and publish test result reports.
- Do not archive test reports: Never save the test results.
Run the job
Run or schedule the job as you would with any standard Jenkins job.
Review the results in the Run Results Viewer
- Extract the files from the archive file. When you when you extract the zip file contents, it creates the following folders and files:
- LRR folder- The Controller raw result folder, viewable in LoadRunner Analysis.
- LRA folder- The Analysis session folder, viewable in LoadRunner Analysis.
- HTML folder- HTML reports in two subfolders, IE and Netscape, in their respective formats.
- SLA.xml - An XML report showing the status of the SLA in the test.
- Open the Run Results Viewer and select File > Open.
- In the Open dialog box, select` Results XML file and navigate to the Results.xml file in the folder that you extracted.
- Click Open and view the results.
Note: The pass and fail criteria for LoadRunner scenario tests are based on the LoadRunner Service Level Agreement (SLA). If you do not define an SLA, the scenario will fail. For details, see the LoadRunner Help Center.
Review the results in Jenkins
You can also view the results from the Jenkins interface, in the following modes:
- Per job/project
- Per build/run
Per Job / Project (cross build / run results)
Click Project performance report in the left side Job menu. This lets you review the various results from the job, per scenario. You compare the job results using an SLA.
Per build / run
- Click Performance report to examine the performance summary report with its different results.
- Click Transaction summary to open a detailed view of the transactions statistics taken directly from LoadRunner Analysis report.
Click Rich Report to show a high level report of the build run. (This requires you to enable Rich Reports in Analysis and generate a PDF. For details, see the Edit Template dialog box.
- Click Simple Junit style SLA result
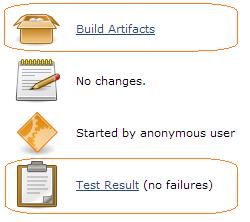
- Click on “Test result”
- Click on “All tests” to see the overview.
- Select a scenario by clicking on its name.
- Click on History in the left panel to compare the results with those from previous runs.
Note: These reports might require you to perform a Security header override. For details, see Content Security Policy Header.
For additional information about the plugin, refer to the plugin’s wiki page. For general questions, visit our Google group.