Plugin Information |
|---|
View Dynatrace Application Monitoring on the plugin site for more information. |
The current version of this plugin may not be safe to use. Please review the following warnings before use:
Older versions of this plugin may not be safe to use. Please review the following warnings before using an older version:
- Improve your delivery cycle and reduce the amount spent firefighting issues later in the release by addressing problems earlier in the development cycle.
- Extend your delivery pipeline with architectural metrics captured on top of your functional/integration tests (such as Unit Test based Framework or HTTP based tests) to get the functionality and architectural confidence to deploy in production.
- Trend Key Architectural Metrics per Build: look behind the scenes and trend key architectural metrics per tests such as number of SQL queries, external API calls, exceptions and log messages for every single build.
Overview
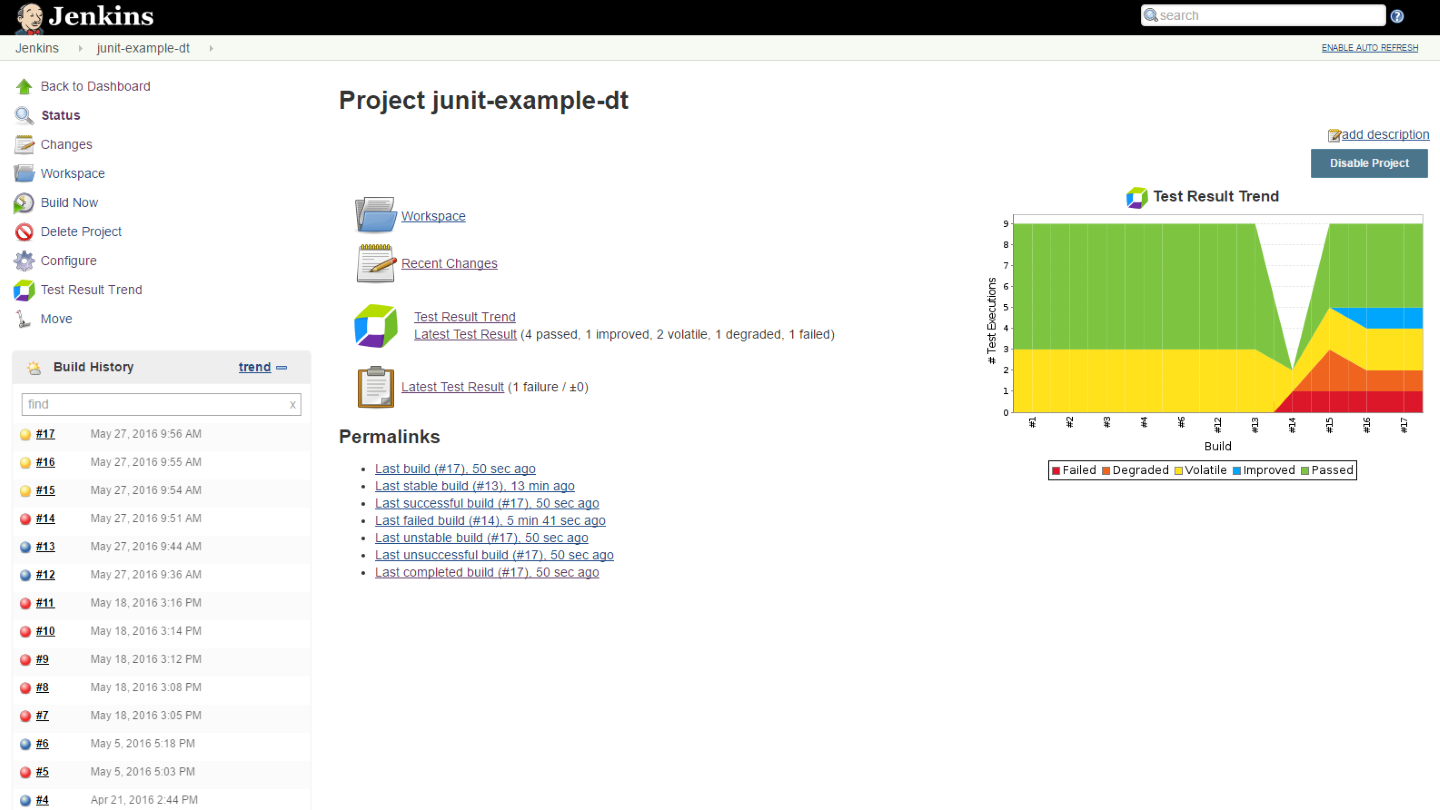
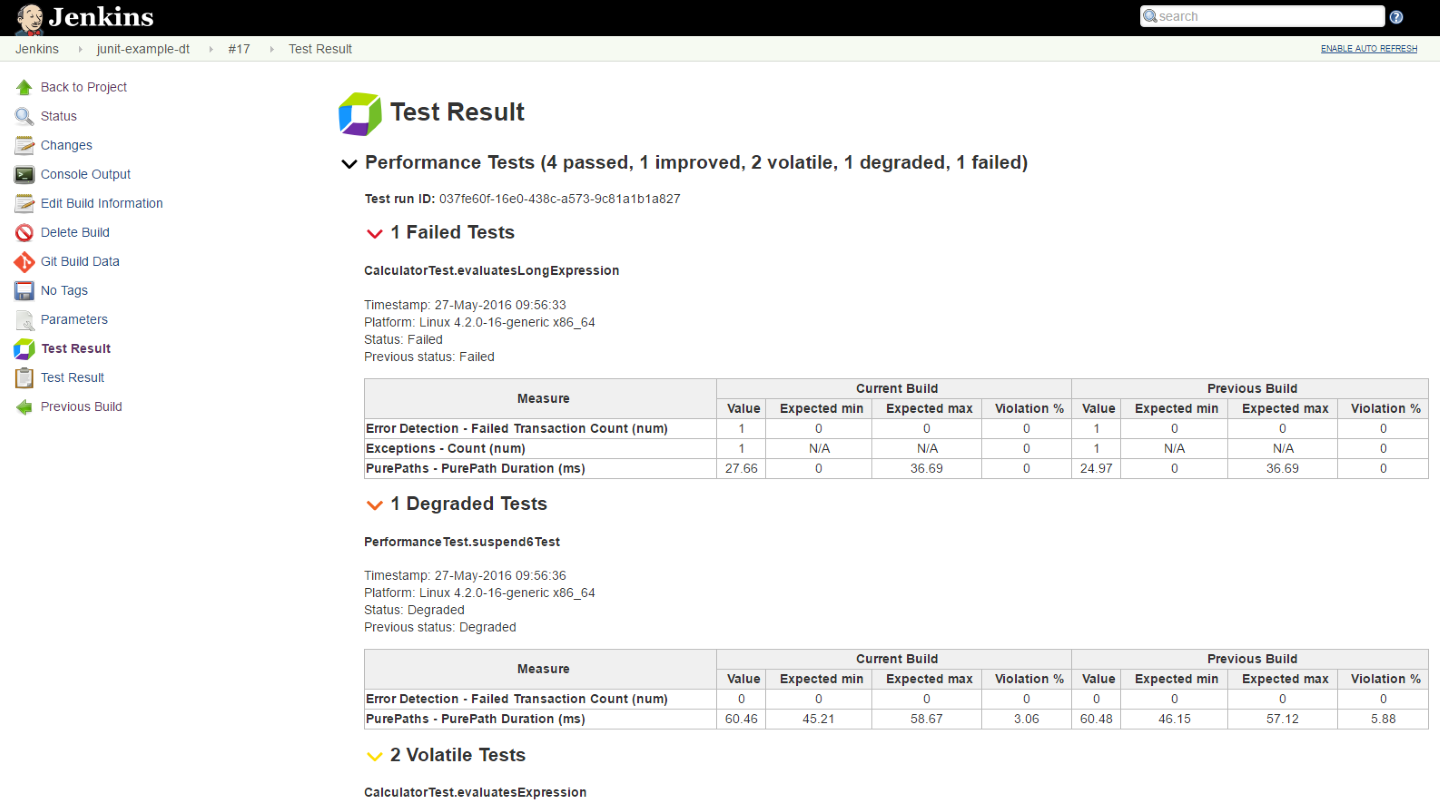
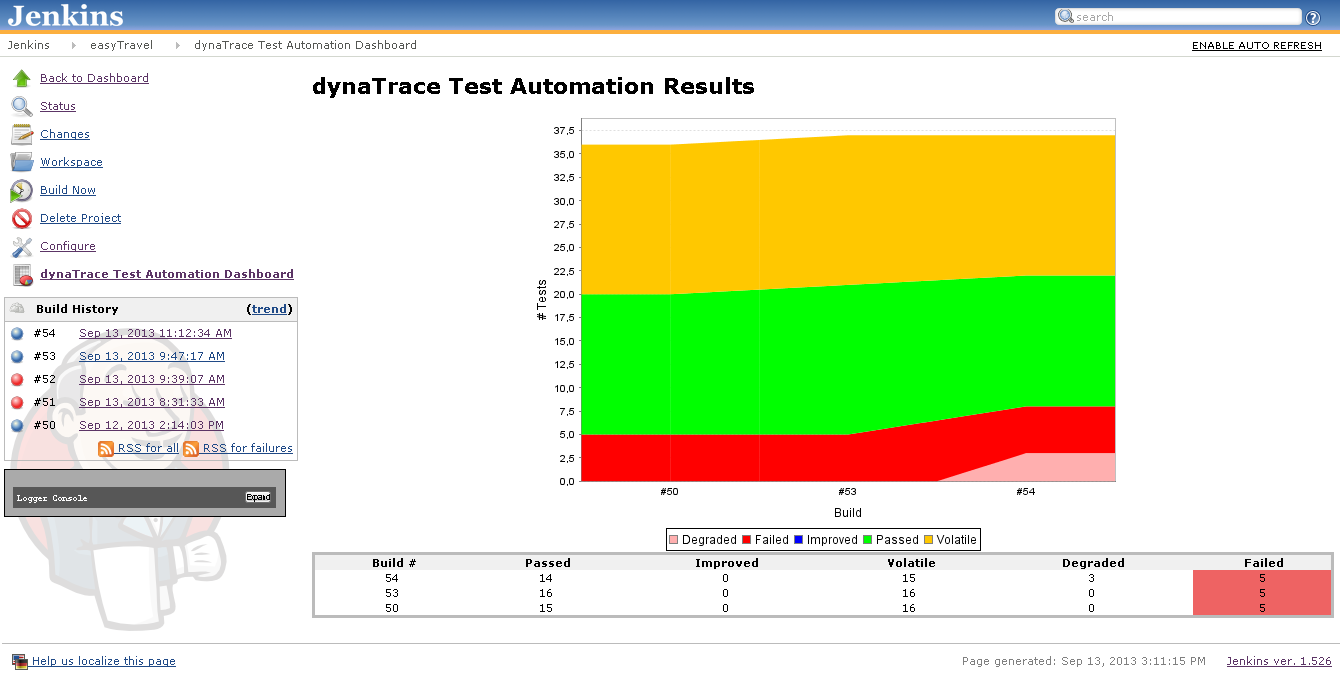
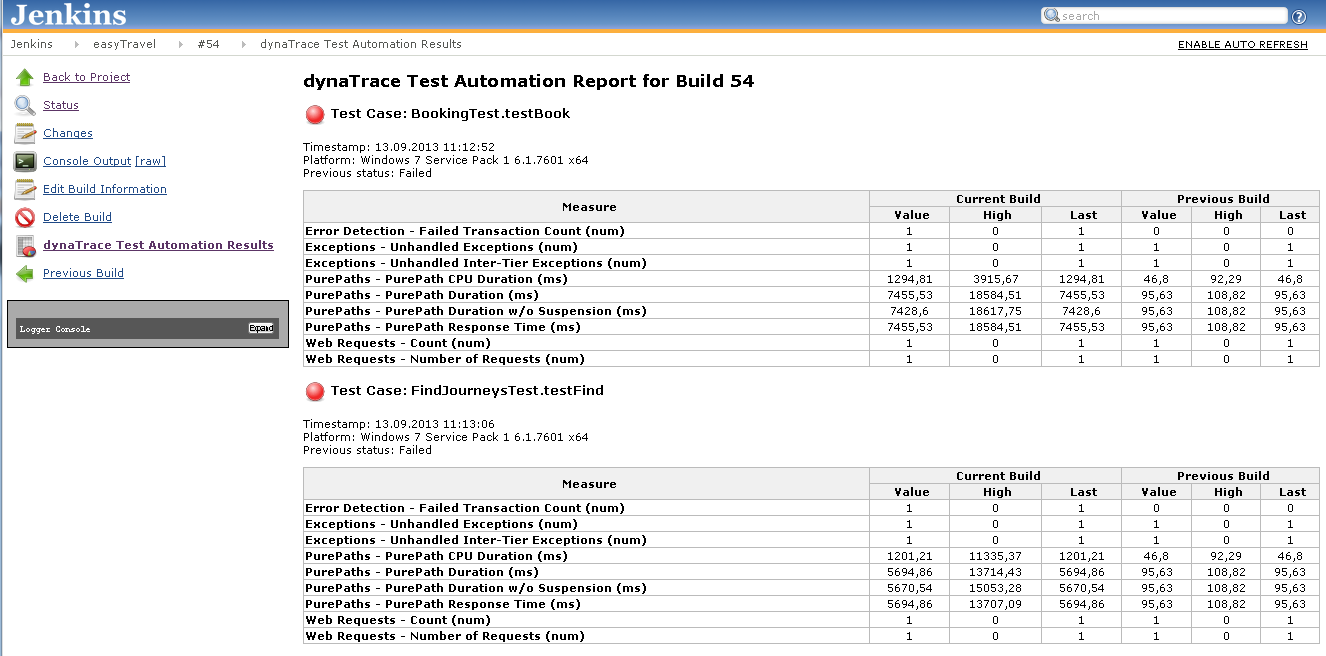
The Dynatrace AppMon plugin displays an overview on recent builds from a performance perspective on the project overview page and it displays individual performance metrics on a build level.
More information: https://community.dynatrace.com/community/display/DL/Test+Automation+Plugin+for+Jenkins
Configuration
Release 2.1.0 adds support for Pipelines. Configuration and usage examples are described here: https://github.com/jenkinsci/dynatrace-plugin/blob/master/pipeline-steps-explained.MD
See also https://github.com/jenkinsci/dynatrace-plugin/blob/master/README.md#configuration
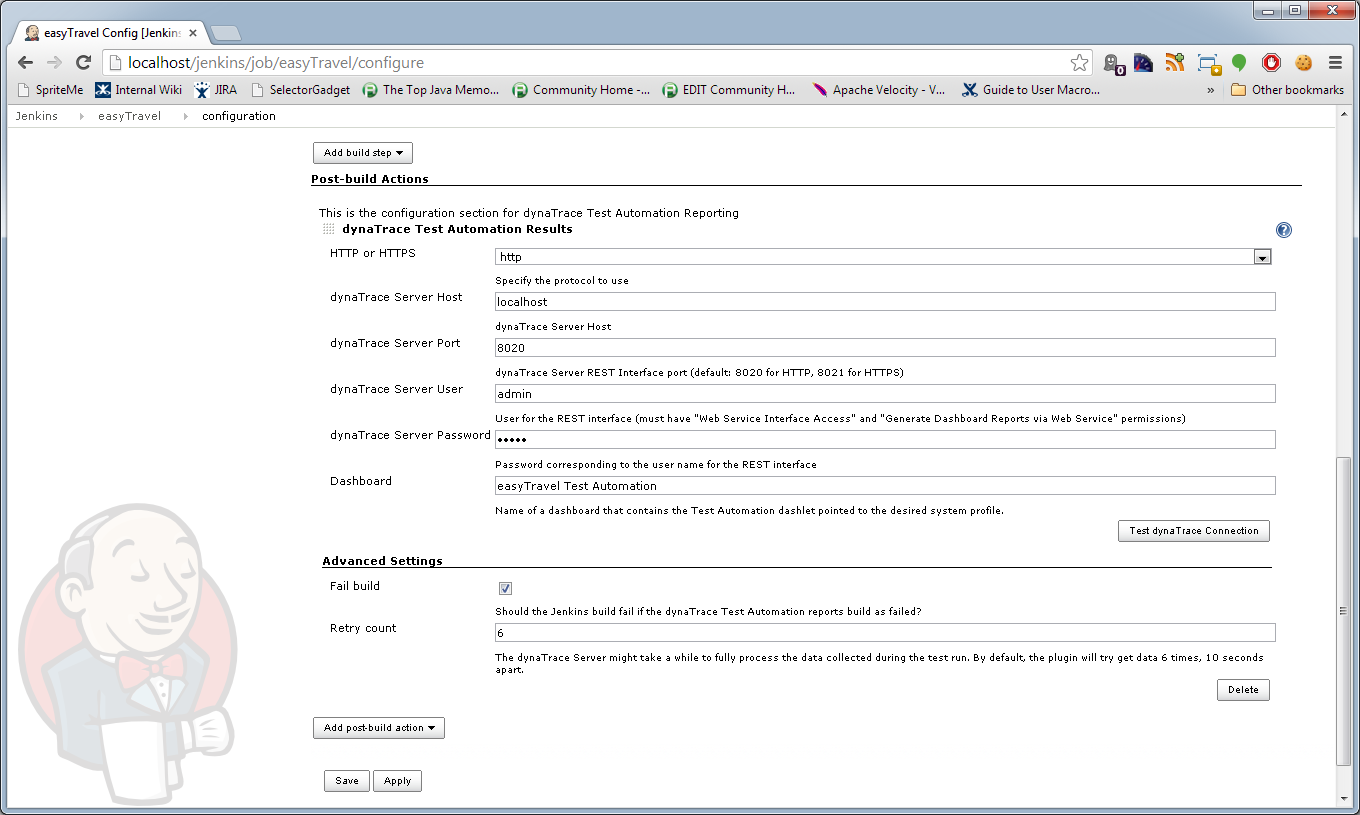
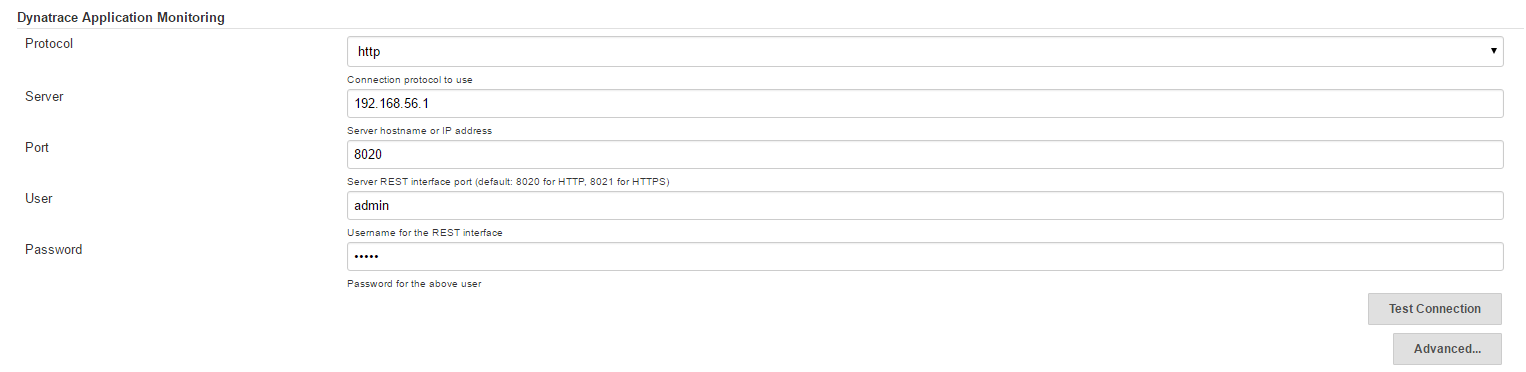
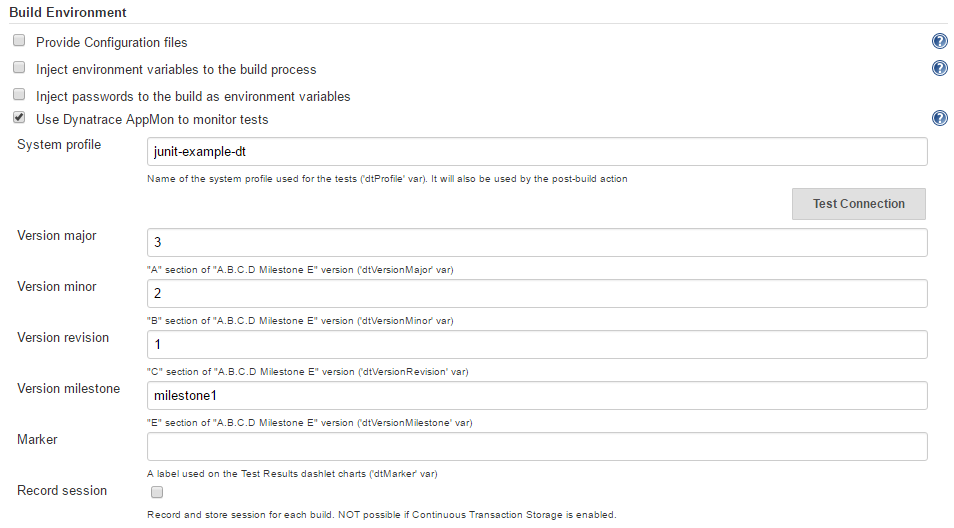
Here you can enter the connection details as well as the name of the dashboard containing the Test Automation dashlet, and you can test the connection.
In the advanced settings, you have the following options:
- You can change whether the build result from the Dynatrace Server should also affect the Jenkins build result - if this is enabled, tests that are considered as volatile or failed (from a functional or performance perspective) by Dynatrace will cause the Jenkins build to be marked as unstable or failed. By default, this feature is enabled.
- Depending on Dynatrace Server load and the number of tests, it might take a while until the test results are available through the REST interface. By default, the Jenkins plugin will try to get data 3 times, 10 seconds apart. If necessary, you can increase the number of tries here. Please keep in mind that this increases the build duration.
Integration
See also https://github.com/jenkinsci/dynatrace-plugin/blob/master/README.md#examples
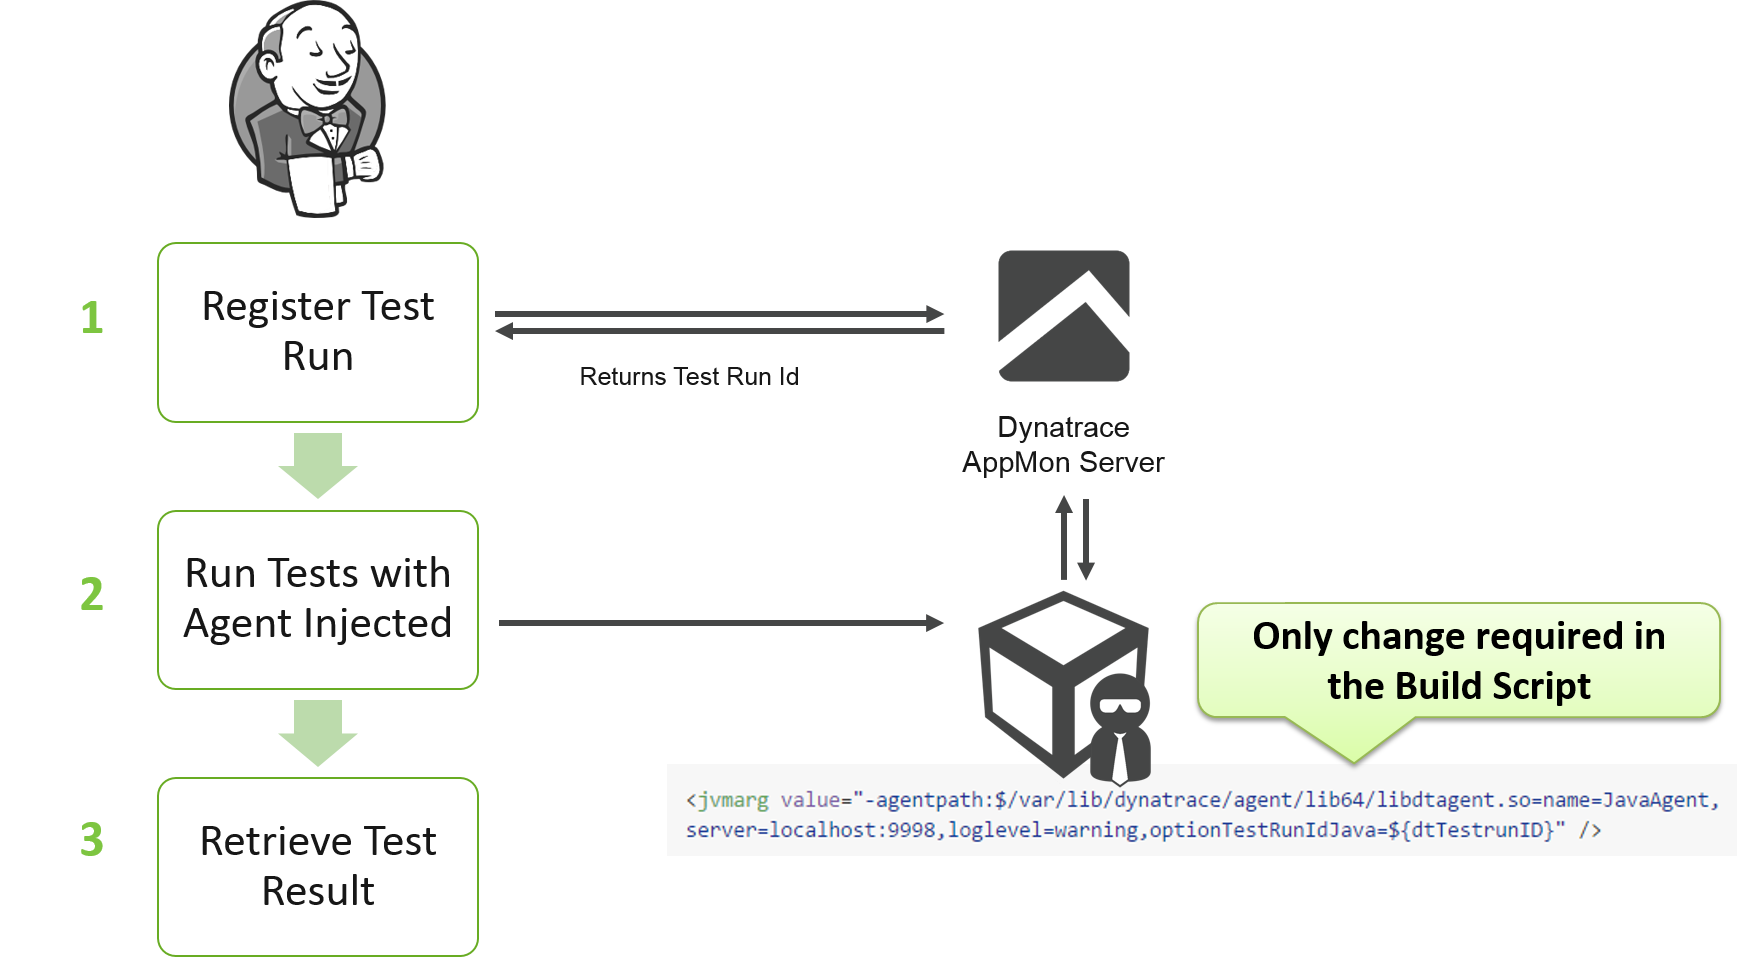
Option 1: Test Run Registration from Jenkins
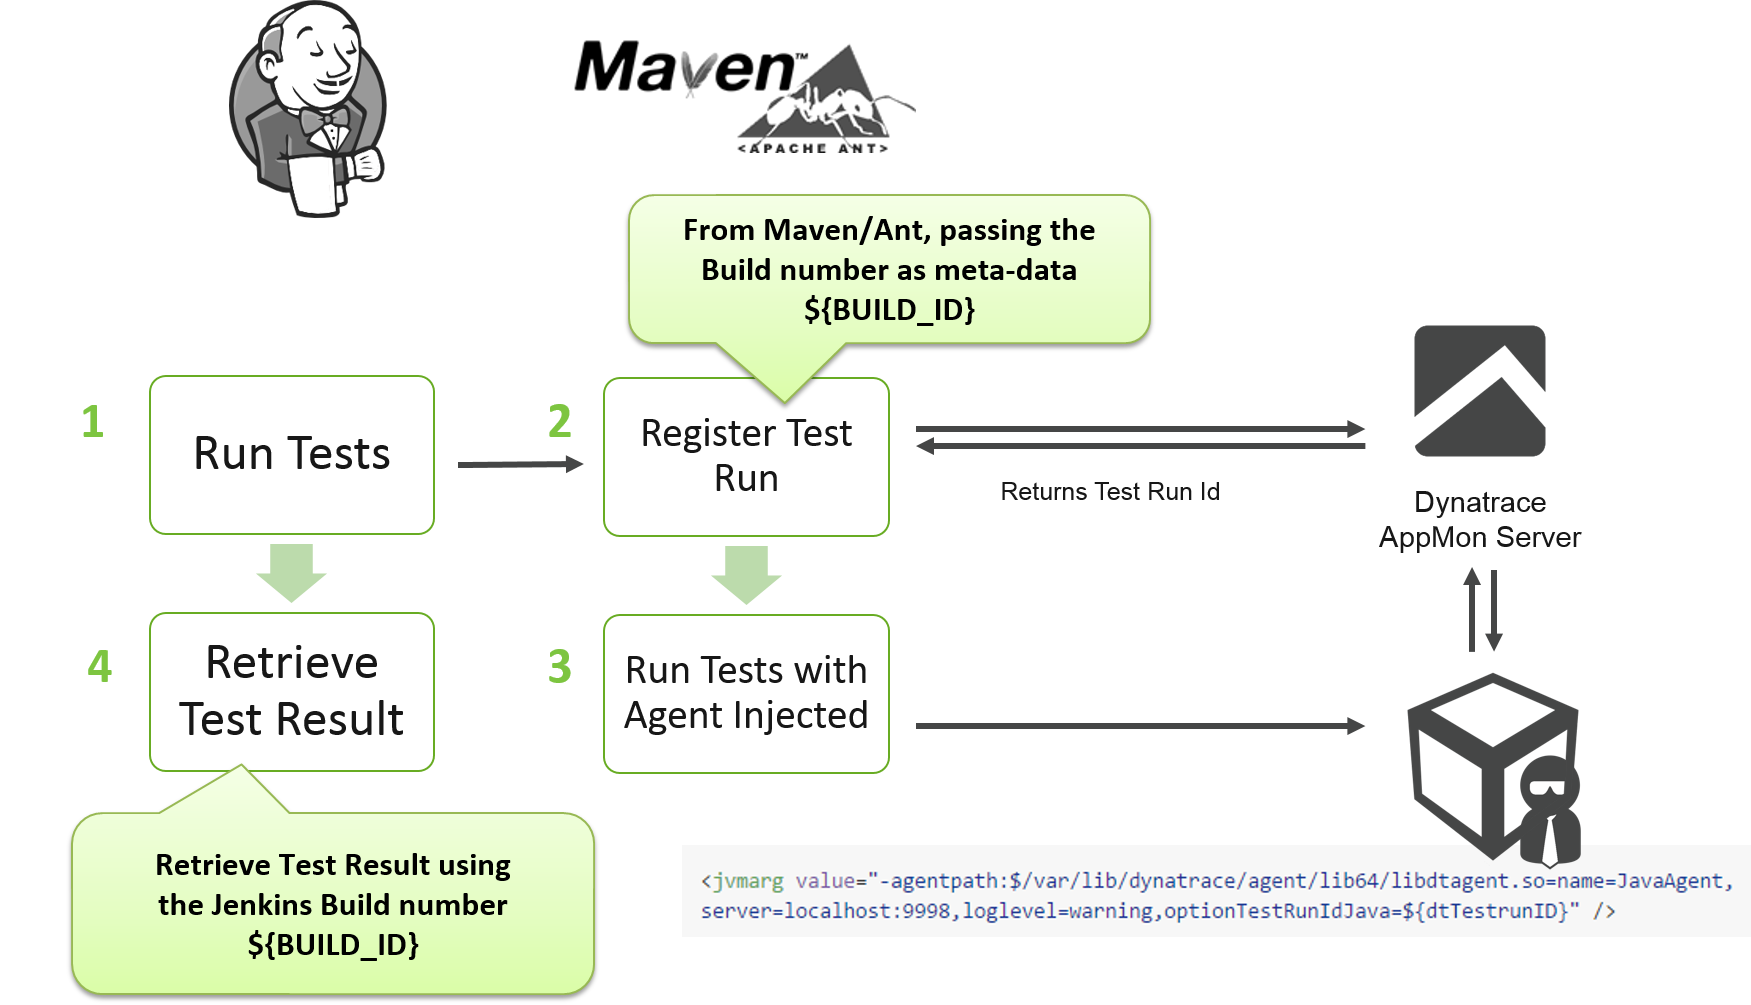
Option 2: Test Run Registration from Maven/Ant/...
Additional resources
AppMon Production Documentation:
- Continuous Delivery & Test Automation
- Capture Performance Data from Tests
- Integrate Dynatrace in Continuous Integration Builds
Blog:
- Continuous Performance Validation in Continuous Integration Environments
- Software Quality Metrics for your Continuous Delivery Pipeline – Part I
- Software Quality Metrics for your Continuous Delivery Pipeline – Part II: Database
- Software Quality Metrics for your Continuous Delivery Pipeline – Part III – Logging
- Automated Performance Analysis for Web API Tests
Recorded Webinar: