This plugin contributes a new view implementation that provides a dashboard / portal-like view for your Jenkins instance.
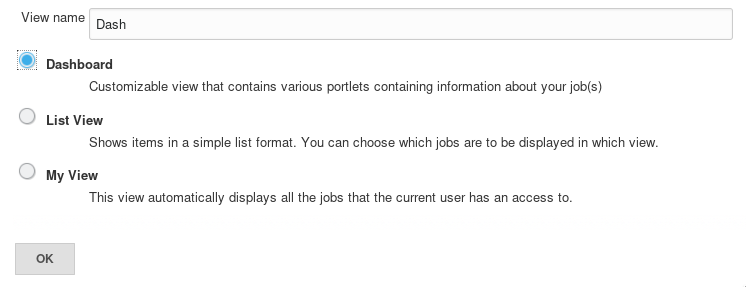
On the Jenkins main page, click the + tab to start the new view wizard (If you do not see a +, it is likely you do not have permission to create a new view). On the create new view page, give your view a name and select the Dashboard type and click ok.
The configuration is done in 2 parts, selecting the Jenkins jobs to include in the view, and selecting which dashboard portlets to have included in the view. The jobs that you select are used for all the portlets to draw their information from.
Select the list of jobs to include in the dashboard. This is exactly the same process as the standard list view that comes with Jenkins.
Also a regular expression can be used to specify the jobs to include in the view.
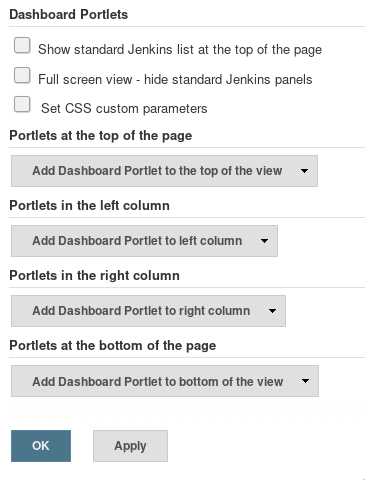
- Show standard Jenkins list at the top of the page: shows uses standard Jenkins jobs list as it would be when using Jenkins' built-in 'List View' type.
Configure which portlets you want to see on the top and on the left and the right column. Each portlet may have its own configuration but at a minimum it requires a name to be given to it.
Click ok and the dashboard configuration will be saved and you will be brought to the dashboard view itself.
The dashboard view supports a layout with rows spanning the entire view with 2 columns.
| Top portlet 1 | |
| Left portlet 1 | Right portlet 1 |
| Left portlet 2 | Right portlet 2 |
| Bottom portlet 1 | |
The dashboard view comes with a number of portlets that you can configure your view with (New portlets can be contributed to Jenkins via other plugins, even your own).
This portlet shows a row for each job showing the standard columns configured in Jenkins. All the configured portlets are displayed below this list.
The jobs grid portlet displays a 3 column table with the current status and a clickable link to the job. This offers a more compressed presentation of your jobs than the standard 1 row per job view, albeit at the cost of some job information.
This portlet lists the unstable jobs within the view. Note, this does not necessarily list all of Jenkins' unstable jobs, but only looks at jobs configured for this view.
The test statistics grid shows detailed test data for the configured jobs. This is useful to get an aggregated count of tests across the jobs in your view. If desired, jobs with zero tests can be hidden.
This is a pie chart of the tests in the configured jobs. It shows the passing, failing, and skipped jobs with the total number and percentages.
This is a chart that shows your tests over time in aggregate. The logic is that for every day since the first job in the view was built, it shows the total number of passing, skipped and failing tests in aggregate across the build. It assumes that if a build did not occur on a given day, that the previous day's build results (or the previous-previous day, etc.) will be used.
Shows statistics based on jobs health.
Shows statistics based on build status.
If you want to contribute to this plugin, you probably will need a Jenkins plugin developement environment. This basically means a current version of Java (Java 8 should probably be okay for now) and Apache Maven. See the Jenkins Plugin Tutorial for details.
If you have the proper environment, typing:
$ mvn verify
should create a plugin as target/*.hpi, which you can install in your Jenkins instance. Running
$ mvn hpi:run -Djenkins.version=2.375.2
allows you to spin up a test Jenkins instance on localhost to test your local changes before commiting.
This plugin tries to migrate to Google Java Code Style, please try to adhere to that style whenever adding new files or making changes to existing files. The style is enforced using the spotless plugin, if the build fails because you were using the "wrong" style, you can fix it by running:
$ mvn spotless:apply
to reformat Java code in the proper style.
Read the Implementation guide if you want to write your own portlet for your plugin.
(This is a curated list. If your favorite plugin is missing, please create a pull request to add it)
- Cadence vManager - This plugin adds an ability to perform REST over HTTP calls to Cadence vManager as a step in your build.
- Cppcheck Plugin - This plugin generates the trend report for CppCheck, a tool for static C/C++ code analysis.
- Maven Release - This plugin allows you to perform a release build using the maven-release-plugin from within Jenkins.
- OWASP Dependency-Check Plugin - This plugin can analyze dependencies and generate trend reports for Dependency-Check, an open source utility that detects known vulnerabilities in project dependencies.
- Parasoft Findings
- Questa VRM - Adds the ability for Jenkins to publish results from Mentor Graphics Questa Verification Run Manager (VRM).
- Release Plugin - This plugin adds the ability to wrap your job with pre- and post- build steps which are only executed when a manual release build is triggered.
- Rich Text Publisher Plugin - This plugin puts custom rich text message to the Build pages and Job main page (for last build). Atlassian Confluence, WikiText and HTML notations are supported.
- SLOCCount Plugin - Adds a portlet showing number of lines, files and languages per job.
- Warnings Next Generation Plugin - This plugin collects compiler warnings or issues reported by static analysis tools and visualizes the results.
This plugin is licensed under the MIT License (MIT), see LICENSE.
- Update this README with more screenshots.
- See GitHub Releases for recent versions
- See the changelog file for versions 2.10 and older


