This plugin shows the coverage/complexity scatter plot from Clover or Cobertura plugin results.
Introduction
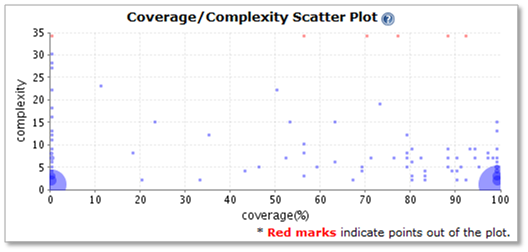
CovComplPlot Plugin shows coverage/complexity scatter plot to easily find out which weakness the code has.
The vertical line indicates complexity value of method and the
horizontal line indicates the coverage.
If there is more than one methods having same complexity and coverage
value, they are integrated and make the point size bigger.
Currently, it supports Clover and Cobertura Plugins. Additional support for LCov and BullseyeCoverage are planned.
Restriction
- Clover 3.X.X is mandatory, This doesn't support Clover 2.X.X.
- Hudson 1.321 or above is necessary.
Developers
- JunHo Yoon. Currently working for NHN corp (http://nhncorp.com)
Changelog
1.1.1 (Aug 13, 2011)
- Update for Jenkins
- Improve handling of empty-string matches
1.1.0 (Oct 21, 2010)
- Add Support Clover Branch Coverage
- Add Support Cobertura Statement Coverage
1.0.0
- Official Release
0.9.8
- Initial Release