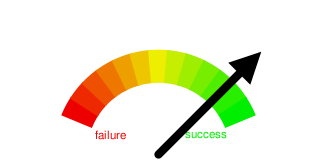
Here's a simple hack using a view's description text to add a Google swing-o-meter to indicate the proportion of builds passing.
Paste this text into the view's description box:
<script>
var xmlhttp = null;
if (window.XMLHttpRequest)
    xmlhttp = new XMLHttpRequest();
else if (window.ActiveXObject) {
    if (new ActiveXObject("Microsoft.XMLHTTP"))
        xmlhttp = new ActiveXObject("Microsoft.XMLHTTP");
    else
        xmlhttp = new ActiveXObject("Msxml2.XMLHTTP");
}
var url = document.location + "/api/xml?xpath=count%28//job[color=%22blue%22]%29div+count%28//job%29"
xmlhttp.open("GET", url, false);//false means synchronous
xmlhttp.send()
var buildSuccessFraction= xmlhttp.responseText
document.write('<img src="http://chart.apis.google.com/chart?chs=320x160&cht=gom&chd=t:' + buildSuccessFraction * 100.0 + '&chxt=x,y&chxl=y|0:||1:|failure|success">')
</script>
Sample:
Security Limitations
Jenkins now prevents script tags being used in the view section. If you accept the risk of allowing script tags in views, then you will need to also include and configure the "Anything Goes" formatter.
